Mastering Dynamic Maps
Facing a challenge in creating captivating visual maps for your presentation? We are here to help you look like the rockstar you are in front of your...
You need data. You need mapping. You need tools to analyze that data. Now you can do everything in a single, easy to use platform.
Perfect for users who need access to basic well level data. If you're only interested in a few wells and currently use state sites, this plan is for you.
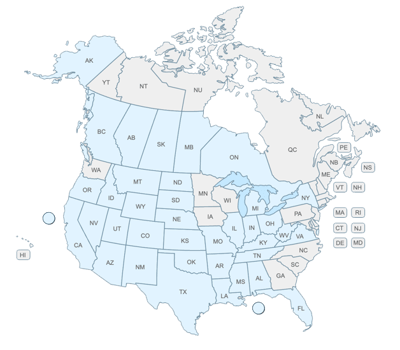
The industry didn't start with unconventionals and neither does our data. We cover the full historical dataset across every producing state and province. Don't settle for inferior data, check out our coverage for any state or province you're interested in.
We are always looking for ways to increase our users experience and add more functionality, without increasing pricing. WellDatabase 23.1 is packed with more analytics, filtering options, new mapping tools, additional security and much more.
You will notice the new look and feel immediately. This article is a guide to help you navigate through the latest release without impacting your workflow, as well as to highlight some of the newest features.
WellDatabase has always had incredible production analytics - with the newest dashboards now available, reporting functionality on permits, rigs, completions, tests, injections, disposition, and stimulations has been unleashed.
Watch key performance indicators with our system KPI dashboard or create your own KPI's.
With the custom dashboards, you are in control of the information that is most valuable to your business goals.
We are excited to include the Rig Layer in this latest release. This layer is updated weekly, and will provide current (or historic) placement of rigs.
Now create map searches with the overlay for Data Layers. Search filters are the default data layer on the map. However, using the overlay for a data layer allows users to compare two datasets that are not directly related, with only the search filtered attributes visible in analytics. Overlay data layers are a visual map representation only and will never appear in analytics.
Activating an interactive layer allows the map shape to be clicked on to learn more about that boundary shape or to create a custom area of interest directly from the map.
Identify hot and cold areas within your search.
Use either as a visualization type in map tools, or as a data layer.
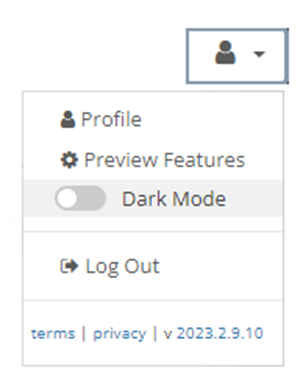
This feature is useful for users spending a significant amount of time working in WellDatabase to help reduce eye strain. Turning dark mode on is easy with two simple clicks. From your profile icon, toggle dark mode on or off.
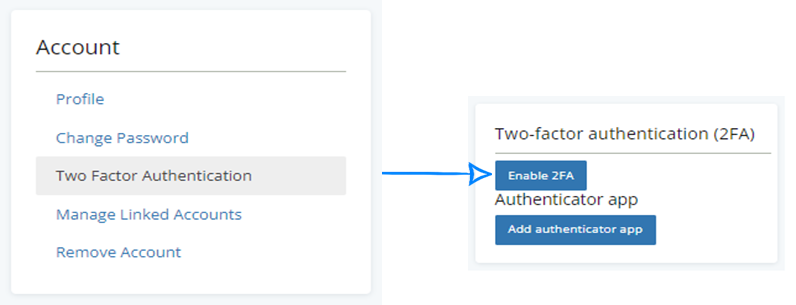
Two-factor authentication will protect your WellDatabase account, even if the password is compromised. When logging in from a trusted computer, click remember this machine after typing in the text code to avoid the second security step every time you login from that device.
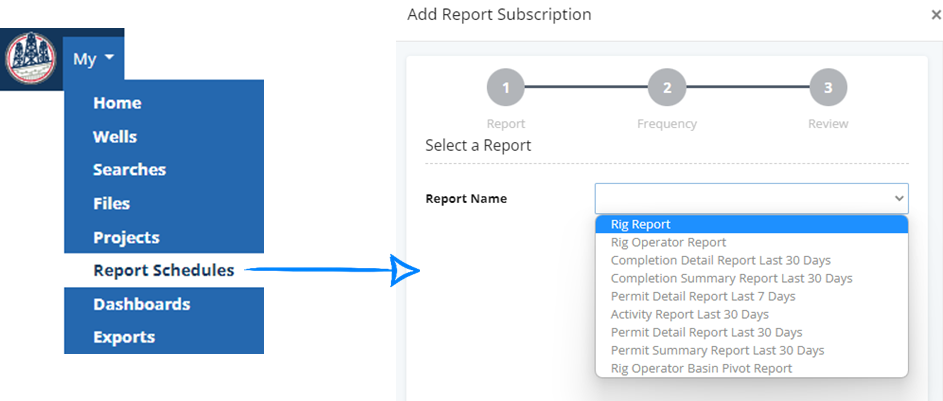
Subscribe to one of our automated reports and have updated information emailed monthly, weekly, or daily. To enable a subscription:
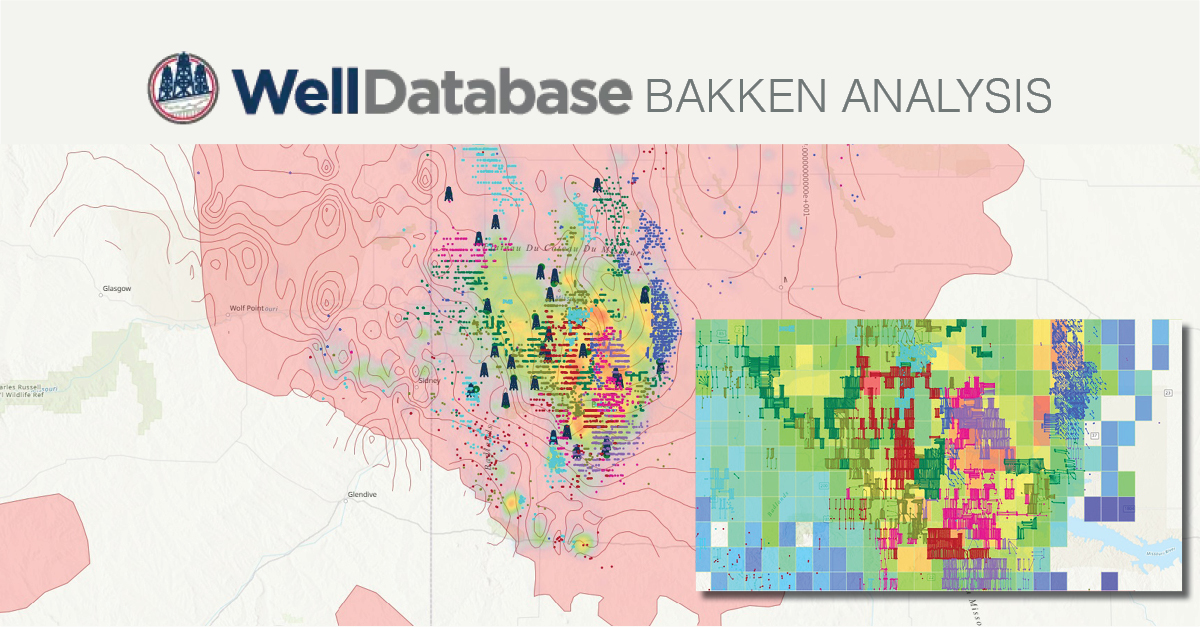
Facing a challenge in creating captivating visual maps for your presentation? We are here to help you look like the rockstar you are in front of your...
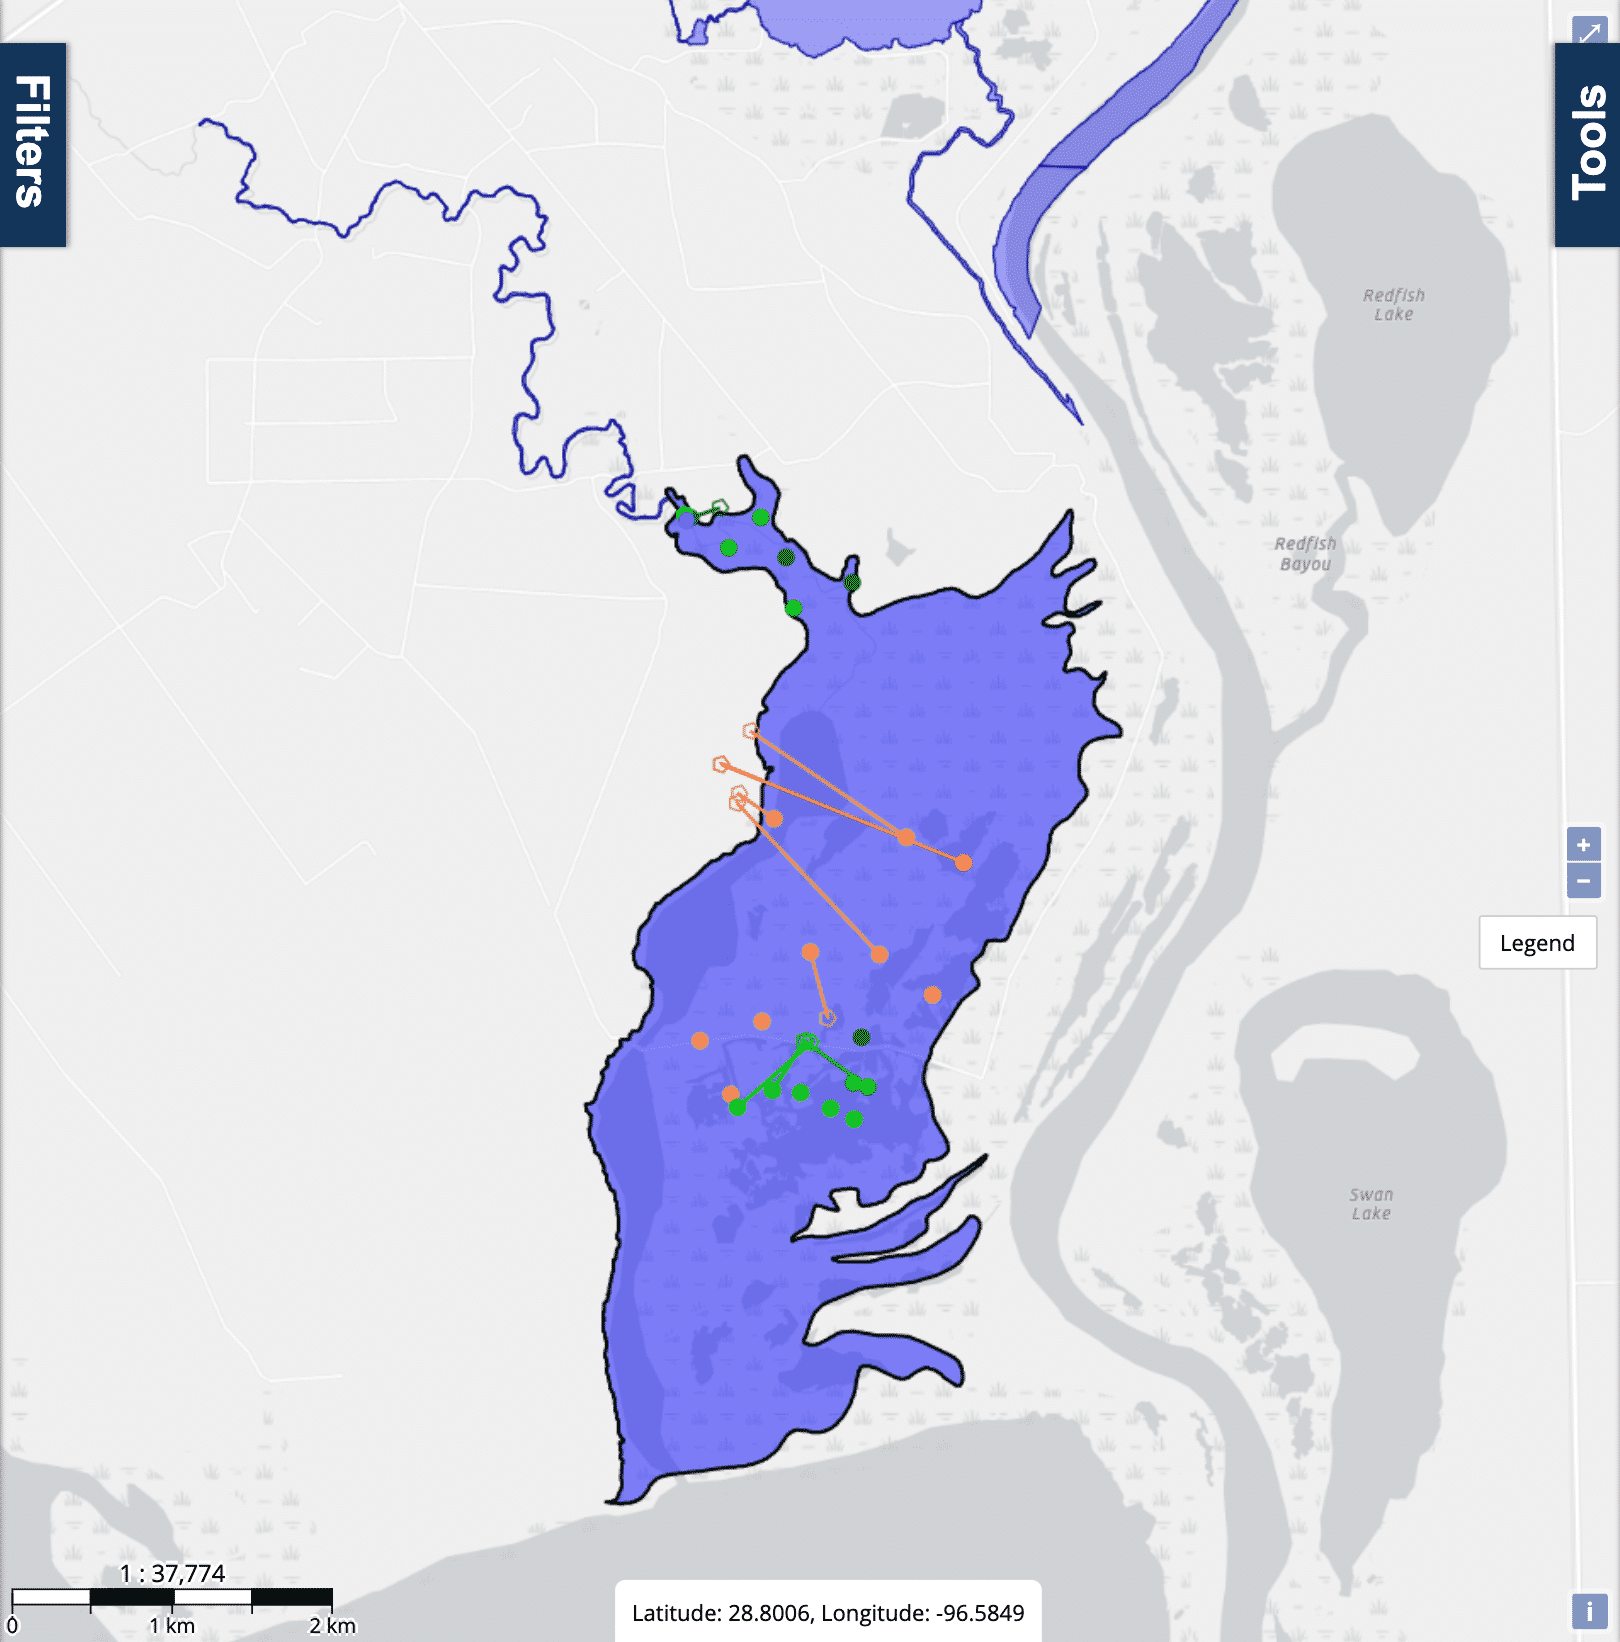
The Q1 2021 Release is packed with new features most of which have come from direct feedback from our customer. In this blog we will take a quick...
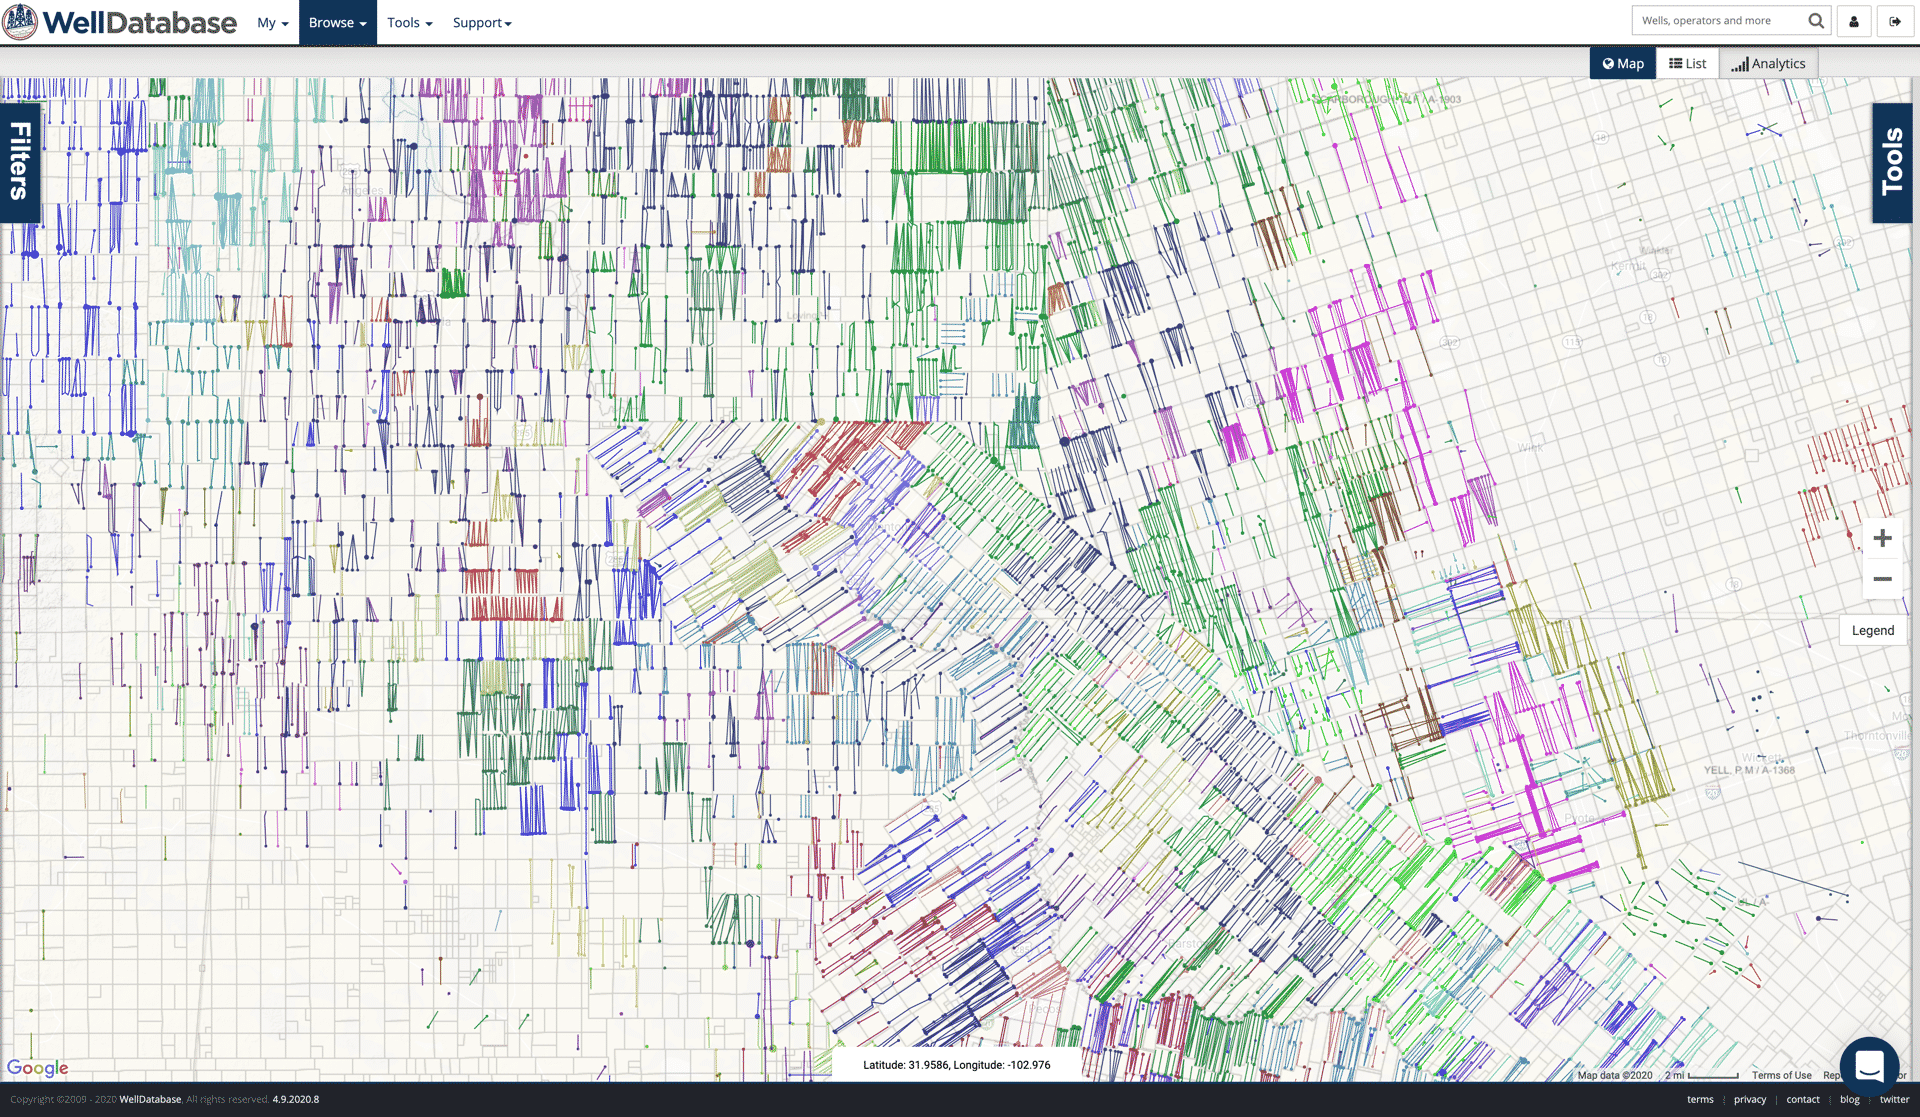
We just rolled out our latest release. The biggest upgrades are around our mapping tools. Here is a rundown of what you can do.