 Avis Blackburn
1 min read
Transitioning to Version 23.1
We are always looking for ways to increase our users experience and add more functionality, without increasing pricing. WellDatabase 23.1 is packed...


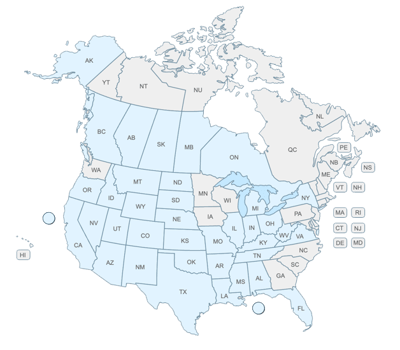
The industry didn't start with unconventionals and neither does our data. We cover the full historical dataset across every producing state and province. Don't settle for inferior data, check out our coverage for any state or province you're interested in.

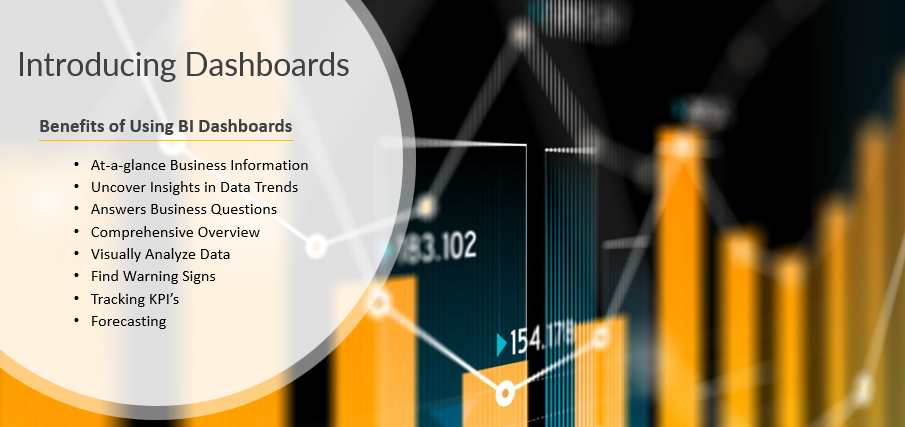
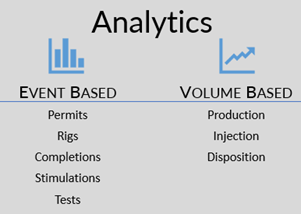
With new dashboards in WellDatabase there are endless opportunities for more analytics.
By adding more analytics options in this version and with the tabs for our most powerful tools already running off the page, we knew it was the right time to clean up the views. We believe that our users will love the more simplified headers, and to encourage that we want to make sure you are able to find everything that used to be right here.
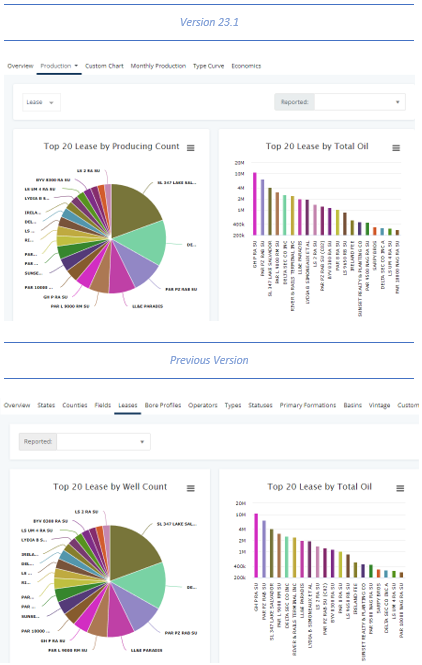
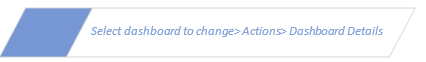
High-level, these two screen shots show the difference in how the headers were then and now.

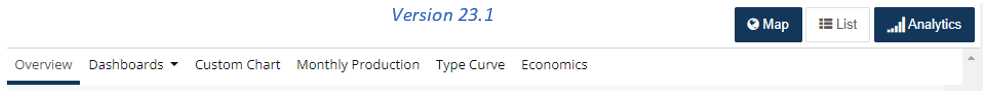
Now let’s dig into to where each of these headers can be found now. While the tab for States, Counties, Fields, Leases, Bore Profiles, Operators, Types, Statuses, Primary Formations, Basins, and Vintage are no longer located in a tab across the header in Version 23.1 – this production data is all still easy to find in the dashboards.
First, we will look at Production, as this dashboard has all the data from tabs that have moved.

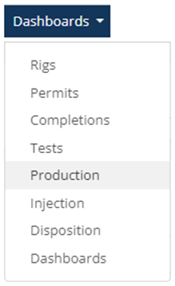
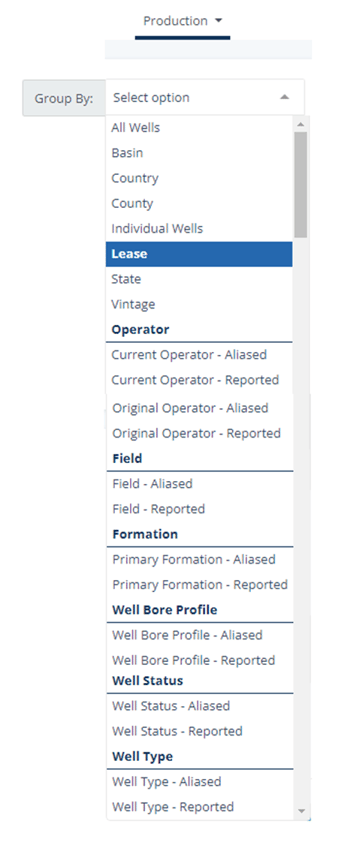
After selecting Production, the dashboard tab is now renamed to Production. The “Group By” dropdown directly under the Production header will provide a complete list of all the tabs that previously were across the top heading, along with several other options.
This is a complete list of data points that can be selected from the Group By dropdown. However, for this example, we will select Lease:
New vs. Old = Same Data, all found in the Production Dashboard. One difference to note is the new report for Top 20 leases by producing count versus the old report which was by well count. Both reports pull the same information, but since the by well count only pulled a count if the well is producing – the name is now more reflective of what data is retrieved.
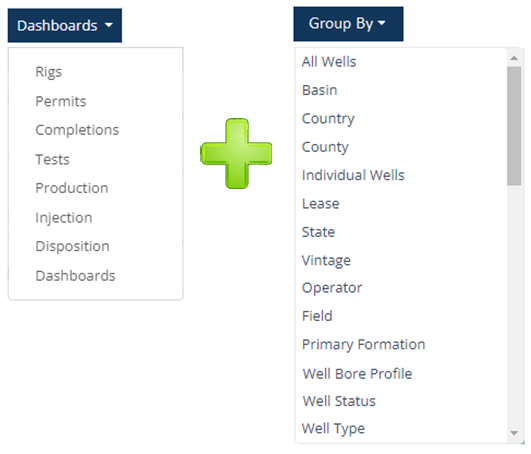
Now that you have learned how to use the production dashboard to access all the information you have come to depend on. Next, discover how to find additional reporting options available in Version 23.1 so you can dive deeper into your area of interest. Take any combination from the dashboard + the Group By data points to drill down even further. There are dozens of reports available inside of the new dashboards that can be customized further by switching between any of the dashboard and grouping options.
: For any data point where there is reported and aliased data available, either method can be selected.
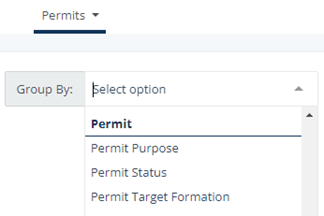
Inside some of the dashboards, there are “group by” options specific to that dashboard. These are the additional options specific to the permit dashboard and will not be found in any of the other dashboards.
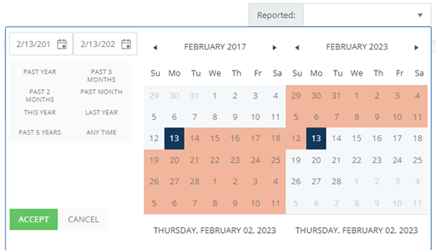
Search by a specific date range or select from pre-built past date options on any of the dashboards.
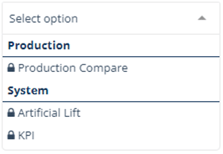
We’ve started all users out with system reports in this section. Values in the system reports can modified while they are open – but will go back to the system default once this section is exited and reentered. Each of the system dashboards will have a lock next to the name, whereas custom dashboards will have a user icon. System reports cannot be removed or permanently edited.

Custom dashboards give users the flexibility to customize how data is organized.


Create this dashboard with a blank canvas or use an existing dashboard as a starting point. For example, if the KPI dashboard is missing a couple pieces of data – use KPI as the template and add one or more widgets or modify some of the data points that came with the system dashboard.
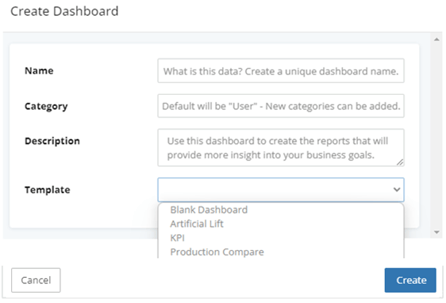
Tip: The dashboard name or category can be changed at any time.
Starting with a blank dashboard is helpful when there is a specific goal for this dashboard and the system or user dashboards have little to no similarities.
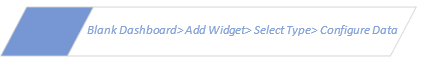

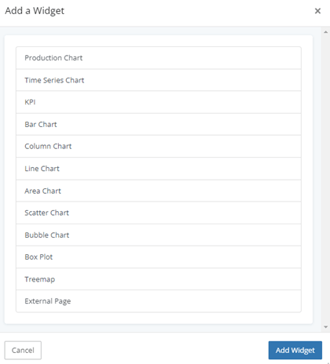
Start by adding a widget and choose from a chart type, KPI or an external page.
We hope you find this blog a useful tool to do more with your dashboards, and understand some of the new features. If you have additional questions, email us: support@welldatabase.com
1 min read
We are always looking for ways to increase our users experience and add more functionality, without increasing pricing. WellDatabase 23.1 is packed...

1 min read
Customize your map with overlays, data layers, a dynamic rig layer, and more for better map visualization digitally or in print. Overlays WDB...
1 min read
From the beginning of our journey with WellDatabase, we received a mix of advice, some valuable and some not so much. Today, we will focus on one...