When the Best Fit Doesn’t Fit
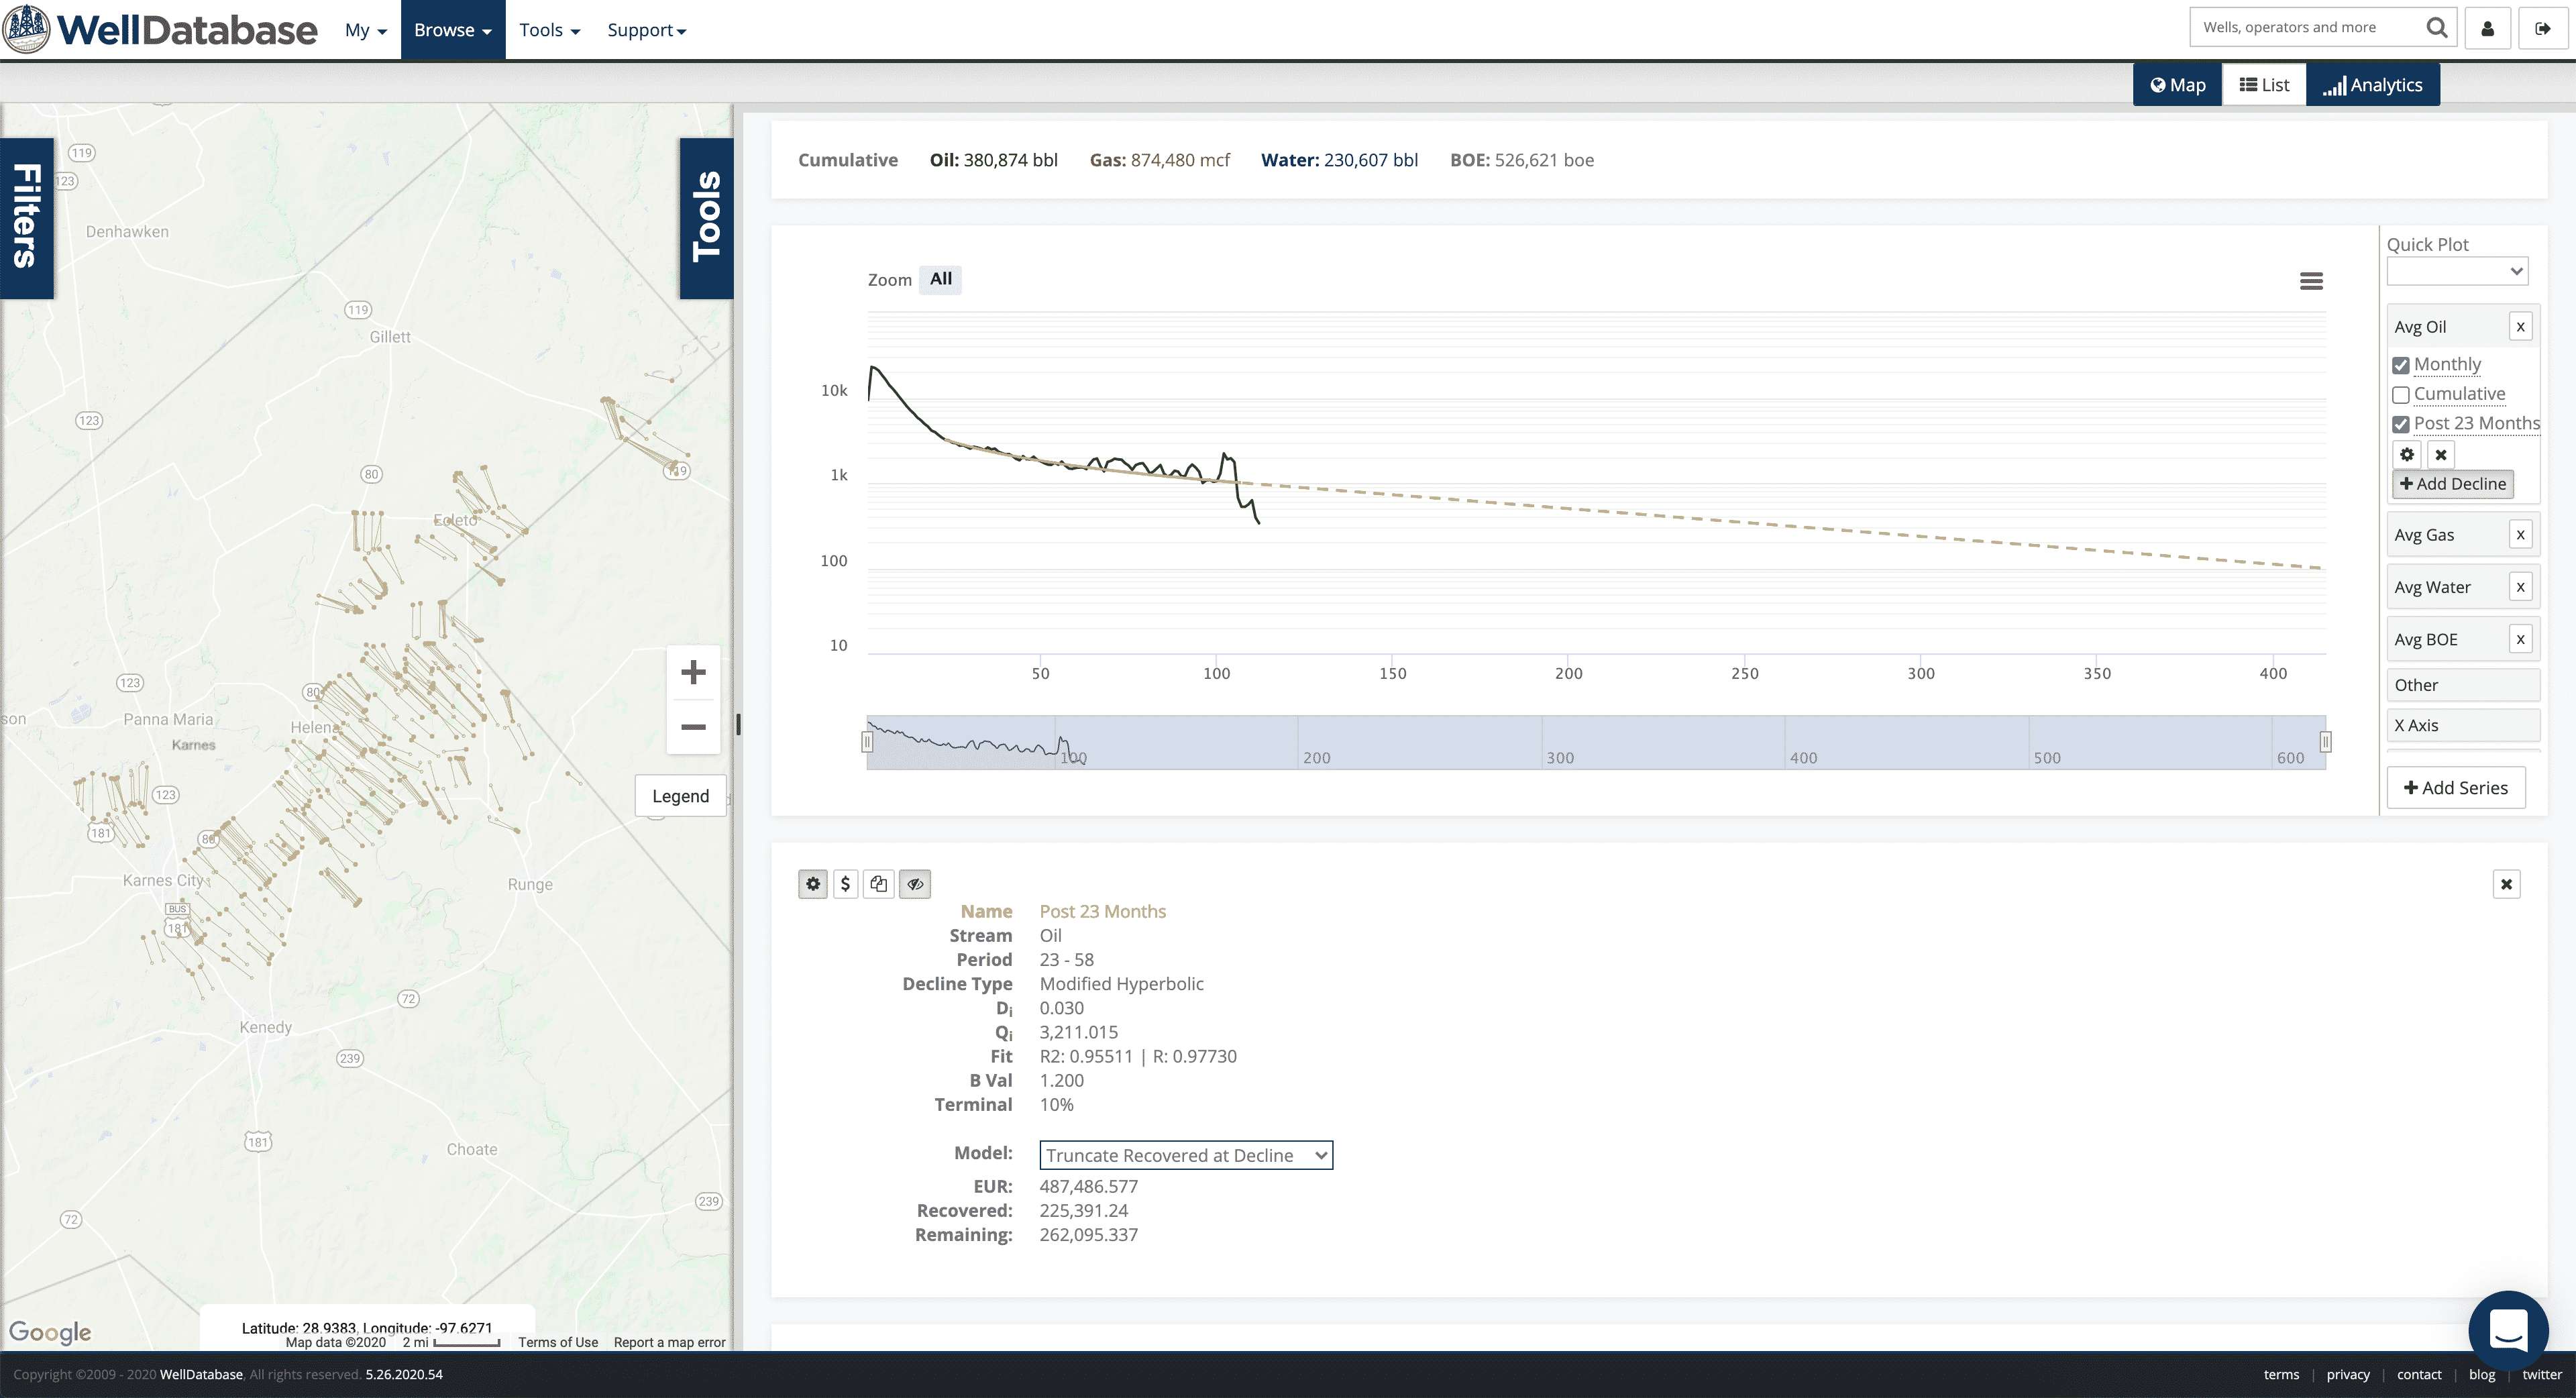
While writing up the post on comparing operators using DCA, we ran across a set of wells where the best fit didn’t exactly fit as well as we would...
You need data. You need mapping. You need tools to analyze that data. Now you can do everything in a single, easy to use platform.
Perfect for users who need access to basic well level data. If you're only interested in a few wells and currently use state sites, this plan is for you.
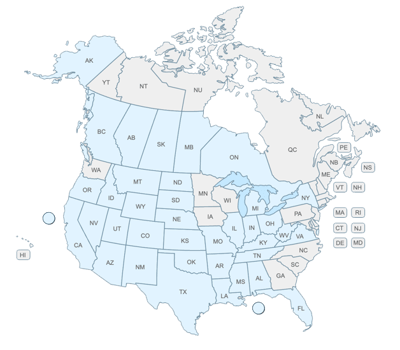
The industry didn't start with unconventionals and neither does our data. We cover the full historical dataset across every producing state and province. Don't settle for inferior data, check out our coverage for any state or province you're interested in.
Get Me Back to the Beach - Discover how WellDatabase's oil and gas production software can quickly and effortlessly help you evaluate assets, so you can get back to enjoying summer.
Ah, the beach, a perfect escape from the daily grind, where work is meant to be left behind. But you did it; you checked your phone and saw you faced the challenge of evaluating a deal or no deal evaluation. WellDatabase is the oil and gas production software that will quickly get you back to the beach.
Gone are the days of waiting for updates, wrestling with cumbersome spreadsheets, or being tethered to your desktop computer. We empower you to effortlessly select the wells that demand attention in your evaluation process. Grab your laptop, phone, or tablet, log in, and access the most up-to-date oil and gas production data. Recognizing this isn't your primary focus; we've engineered a technically robust and incredibly user-friendly interface for your convenience. So, let's get started with 4 steps to evaluate your assets.
Step 1: Select Your Wells of Interest
The first step is to jump into the mapping interface and enter API numbers, or well names, to quickly find the wells you want to evaluate.
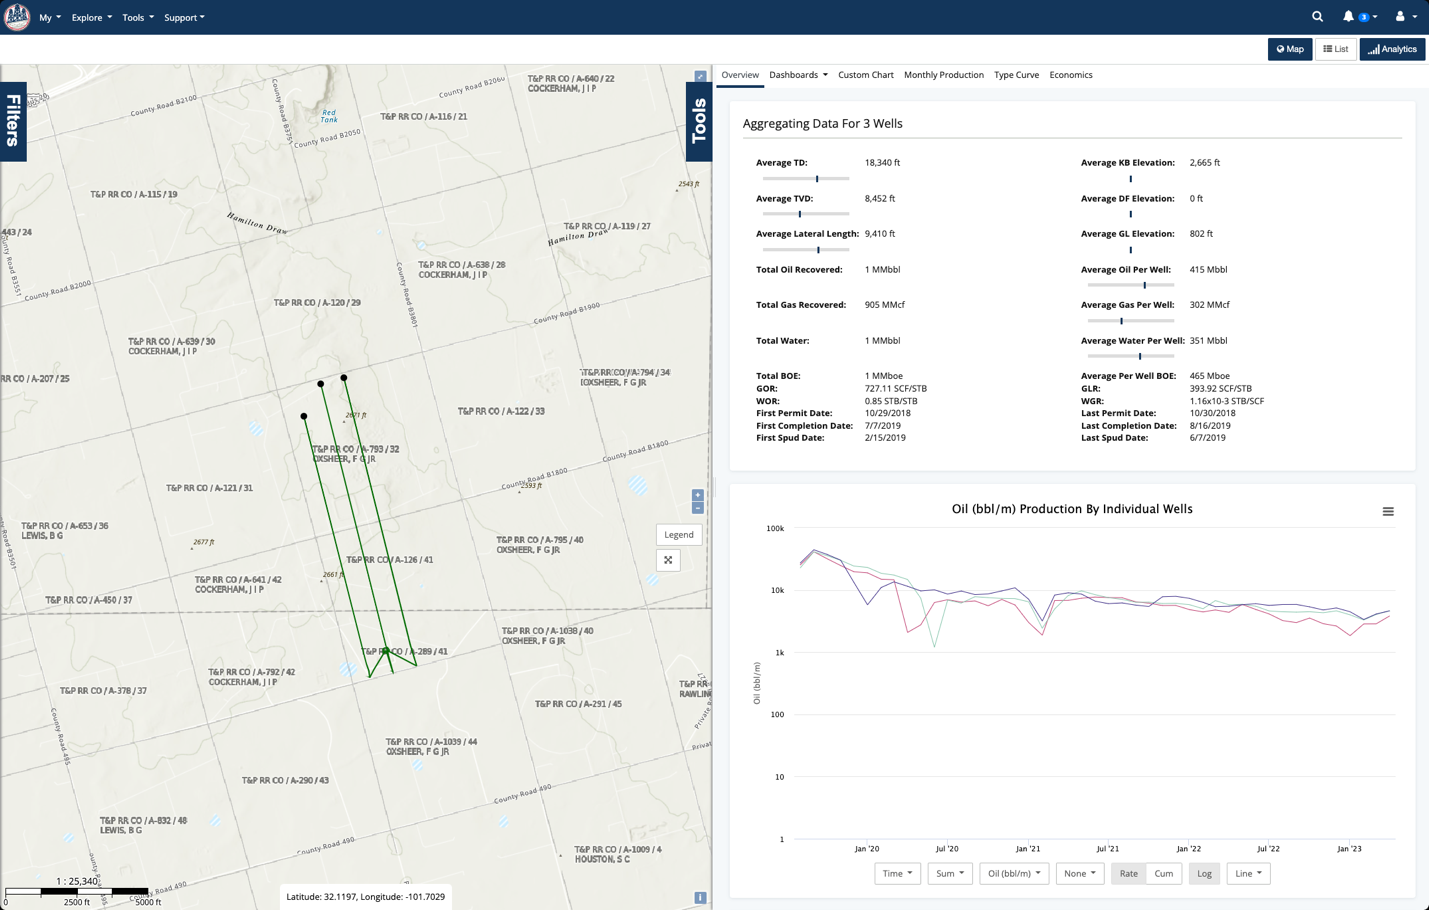
Then convert the filter set into a Data Layer with a solid color and a larger size. This makes it easy to see the wells you are evaluating and allows you to identify offset candidates more easily later.

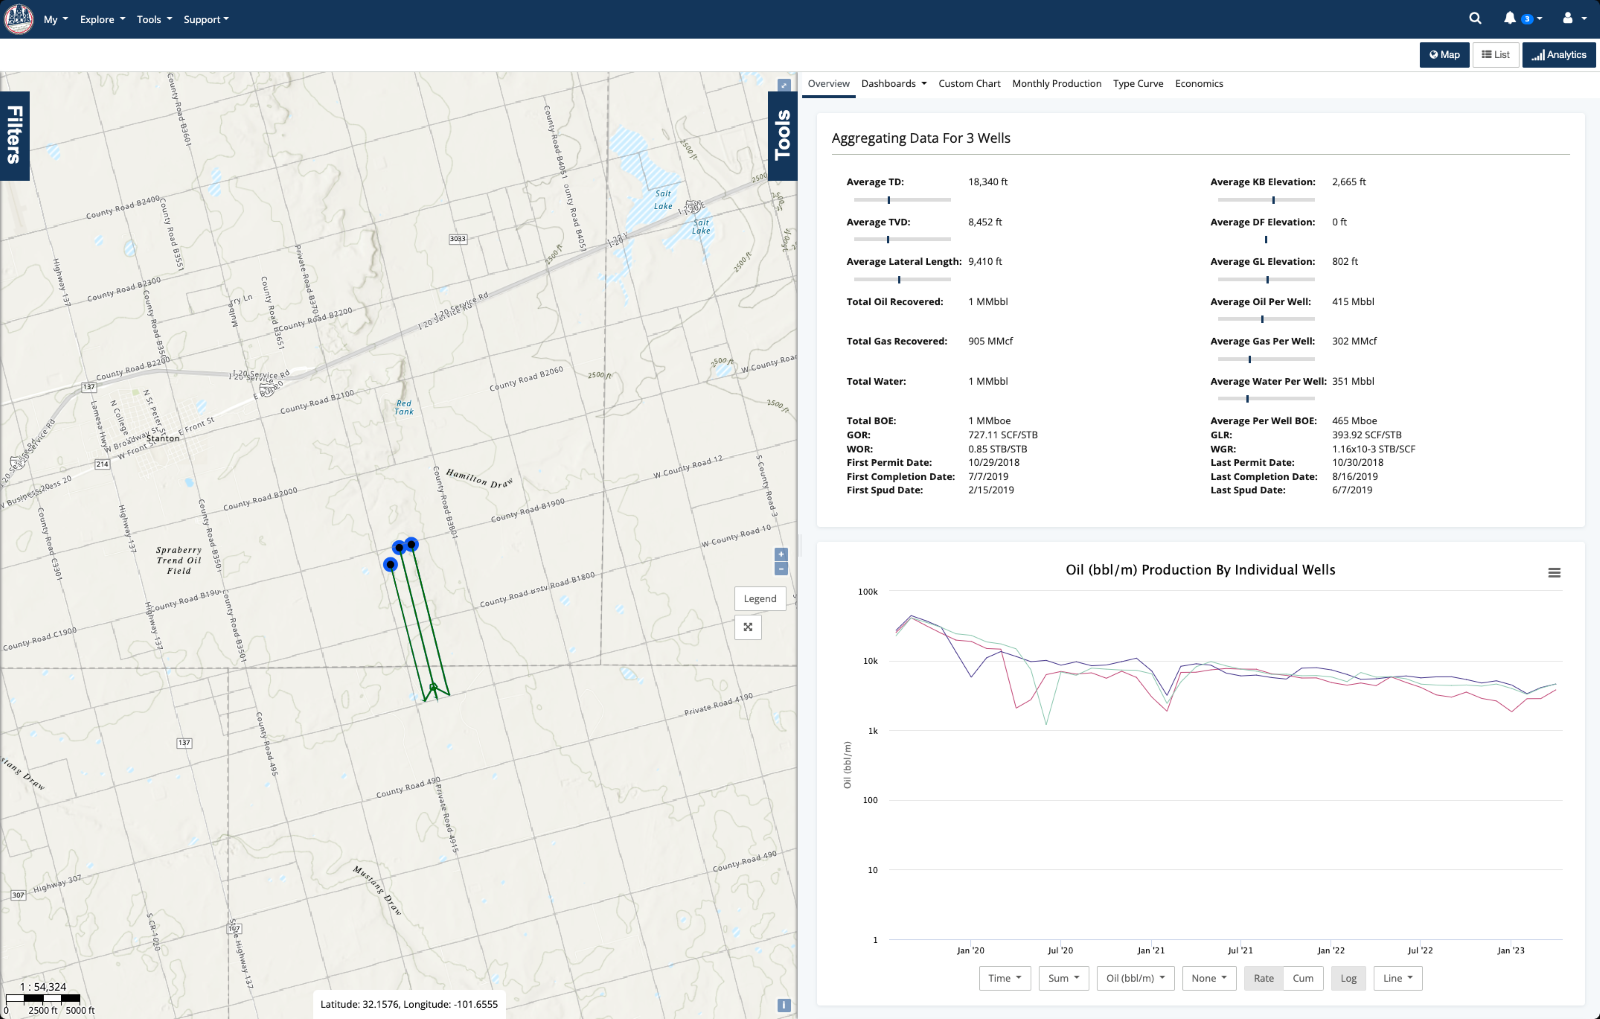
Now the evaluation wells are highlighted, making identification on the map easy.
Step 2: Run Automatic Declines
On the Type Curve tab, generate a decline per stream, and check the summary below to see the EURs. The best fit process runs best fit simulations using the supplied value ranges, which results in over 10,000 simulations in most cases. It then selects the curve that best fits the recovered volumes in the fit window. The best fit is determined by the curve that minimizes the sum of the least squares. The summary card below displays the parameters Di, b-val, and Dlim (in the case of modified hyperbolic) used to generate the curve. This is all done automatically when you click Add Decline. If you prefer to enter parameters manually, that’s ok too. All the decline parameters are editable in the decline settings dialog.
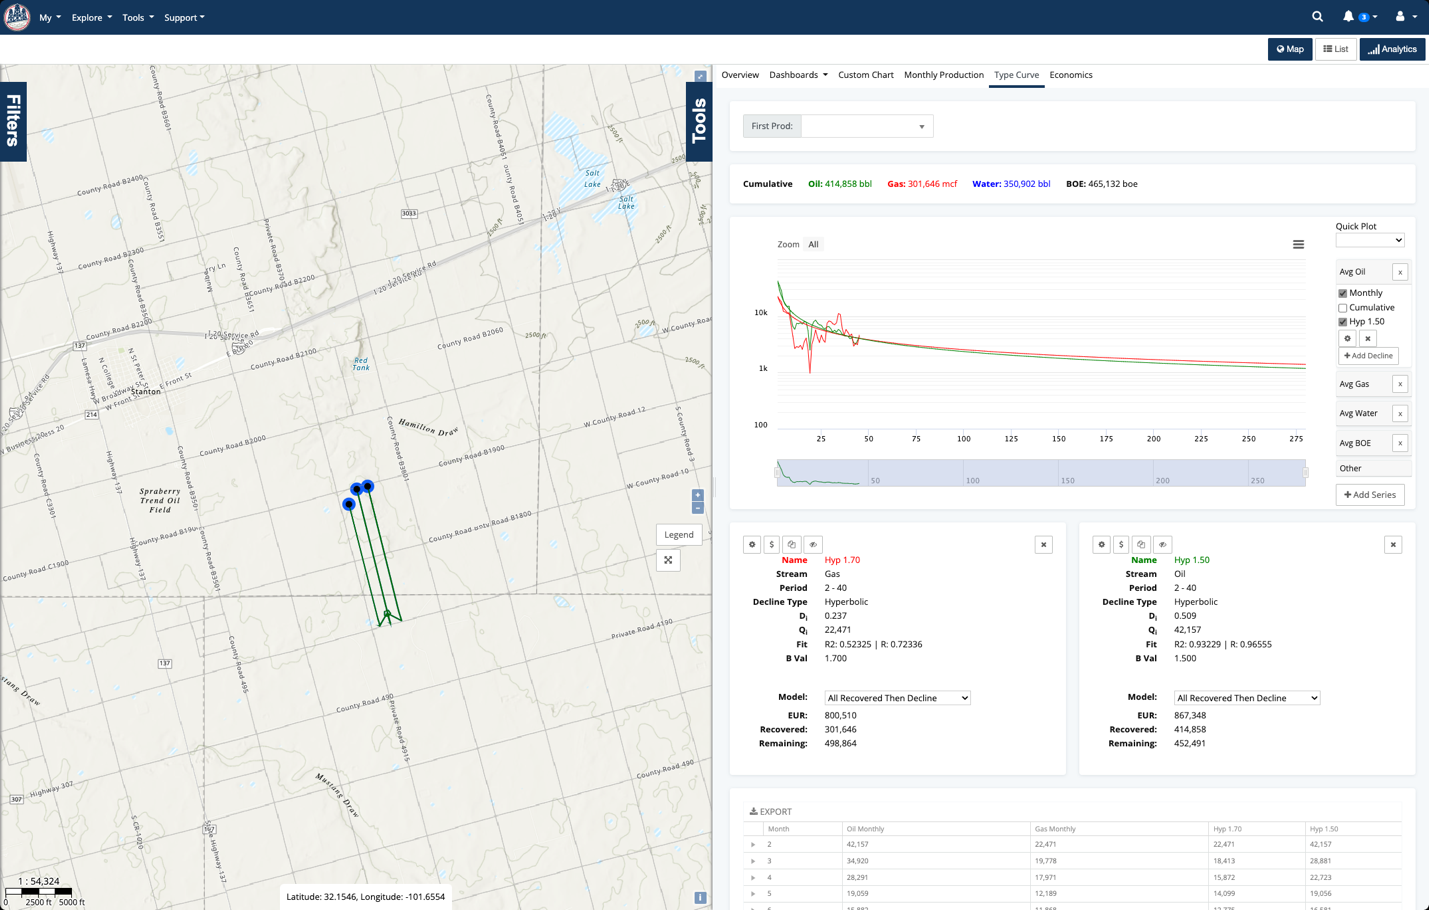
The EURs calculated from the generated decline curves suggest that these wells still have a lot of potential over the next twenty years. Let’s see how they compare to other wells in the area.
Step 3: Look at Production and Compare with Offset Wells
When evaluating an opportunity, performance benchmarking gives you great insight into how the wells are performing. Are they underperforming? Are they boomers? It’s hard to tell without comparing them to other wells in the area. To benchmark wells, you need to establish a set of offset wells for comparison. Establishing good offsets can be challenging; read up on our tips for identifying offsets in our previous blog.
To start picking offsets, exclude the evaluation wells and create a 2-mile radius around the wells you are evaluating. To get close to an apples-to-apples comparison, filter to the wells that started producing in the last eight years in the same basin, with a similar lateral length.
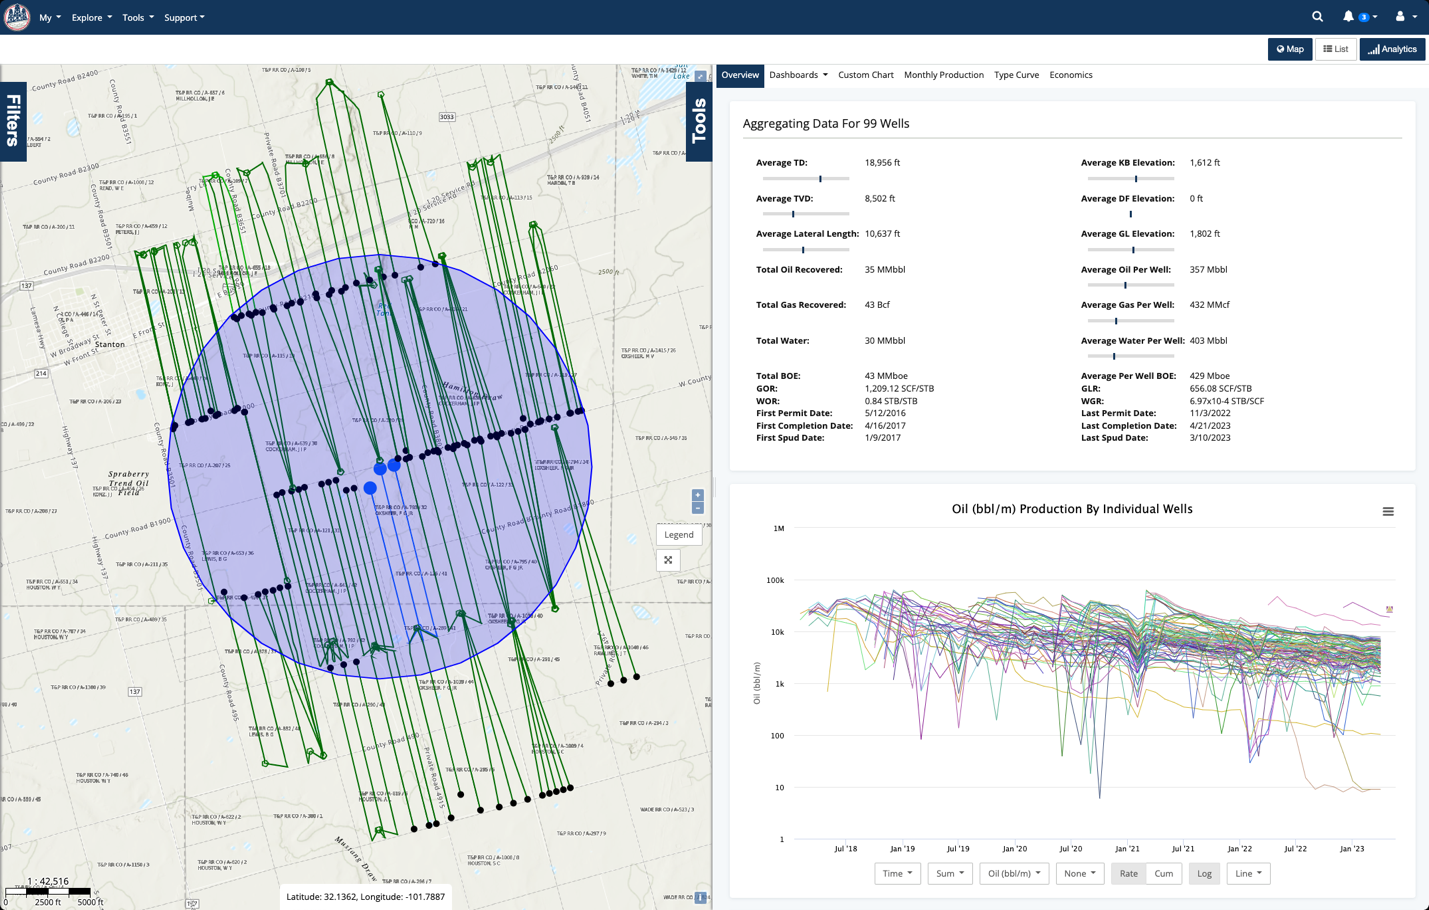
Now flip over to the Production Analytics to compare the individual well production profiles and remove any outliers.
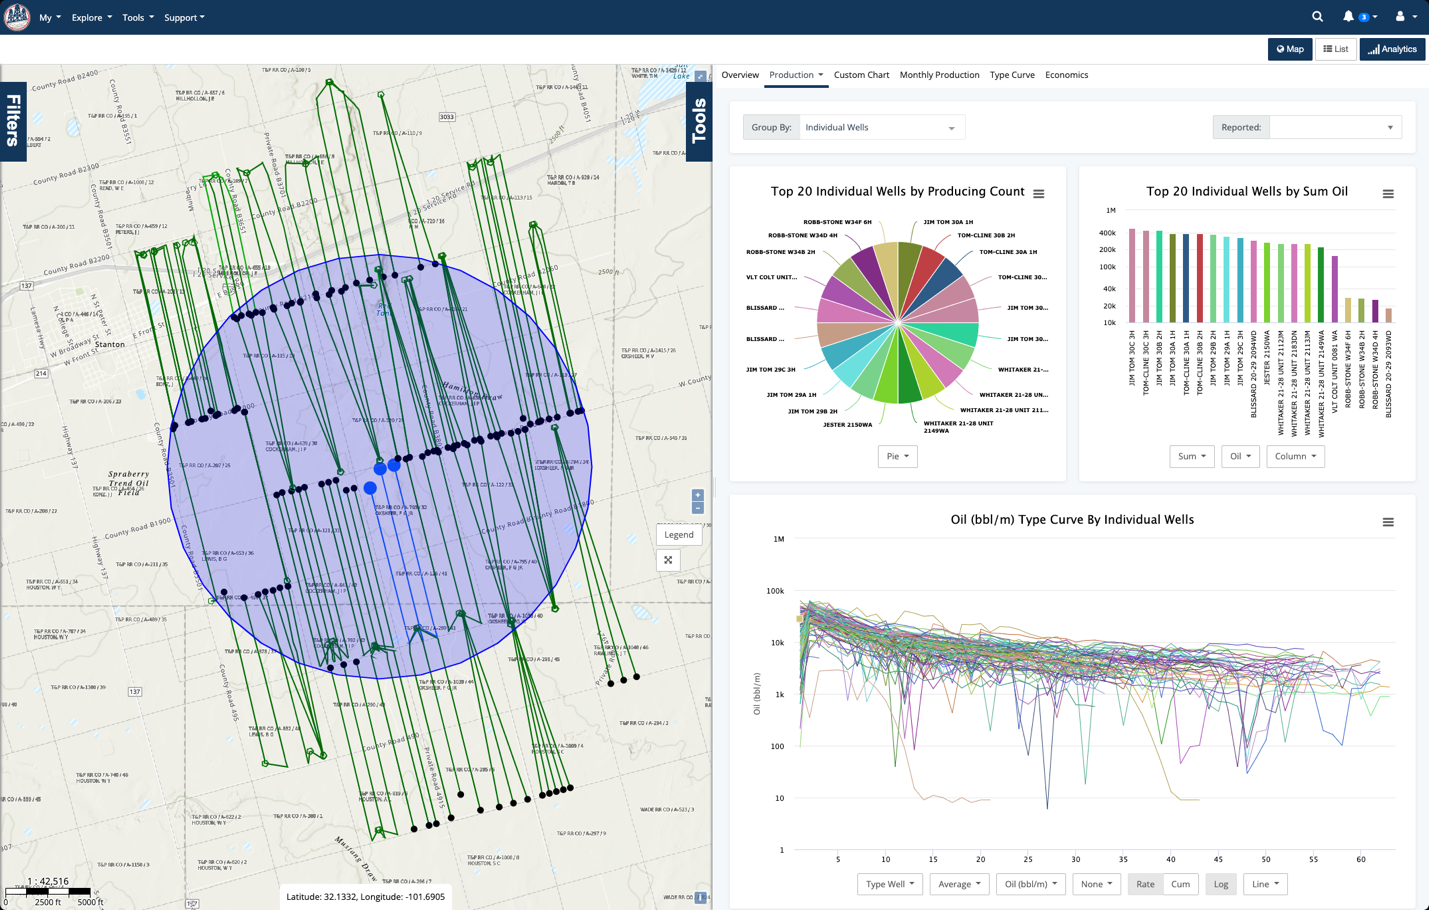
There are a few underperforming wells in the set that you can click on and exclude from the offset list.
.gif?width=732&height=466&name=2023-07-31_19-15-52%20(1).gif)
You can keep excluding wells until you are satisfied with the offset list. With just a few clicks, you are left with a nice set of wells with similar production profiles to the wells you are evaluating.
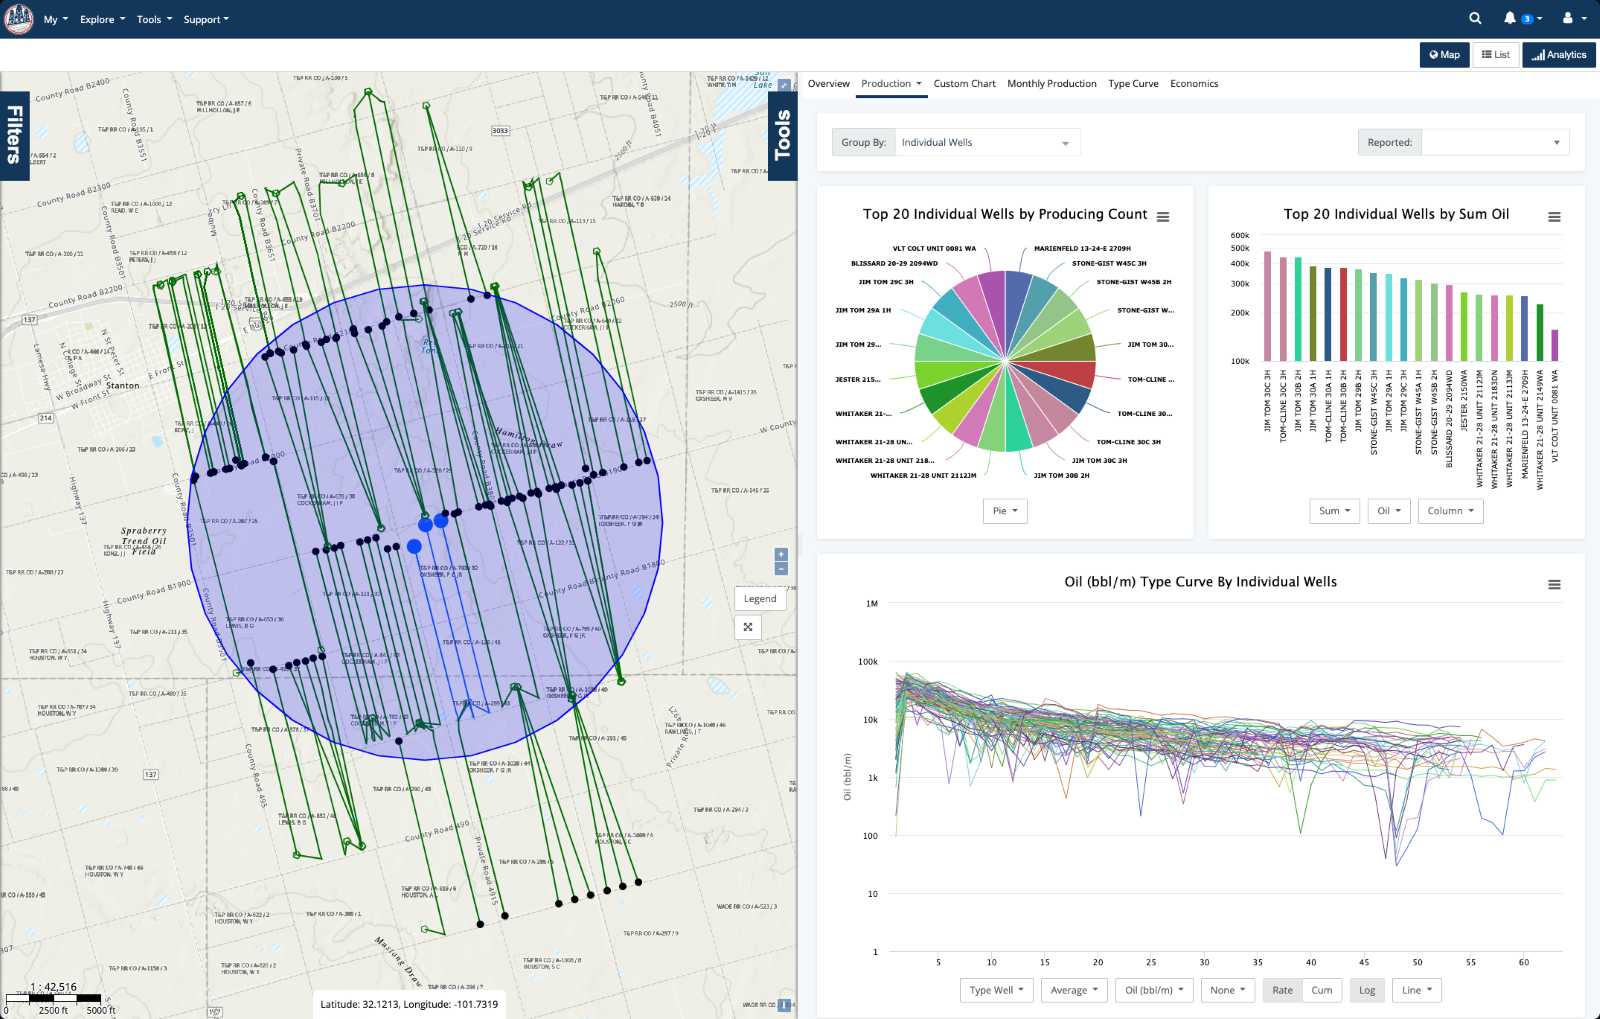
Now that you have a set of offsets grab the top and bottom five producers in the set and see how the wells compare.
.gif?width=740&height=471&name=2023-07-31_21-14-36%20(1).gif)
The interactive analytics make it simple to see that the target wells fall right in between the top and bottom producers in the offset well list.
Step 4: View Economics and Export
With results in hand, it's time to dive into economics. Click on the Economics tab for a quick view of the expected return based on current performance. By default, the economics tool generates an economic report for twenty total years, but you can modify that for each stream to get an idea of future returns as well.
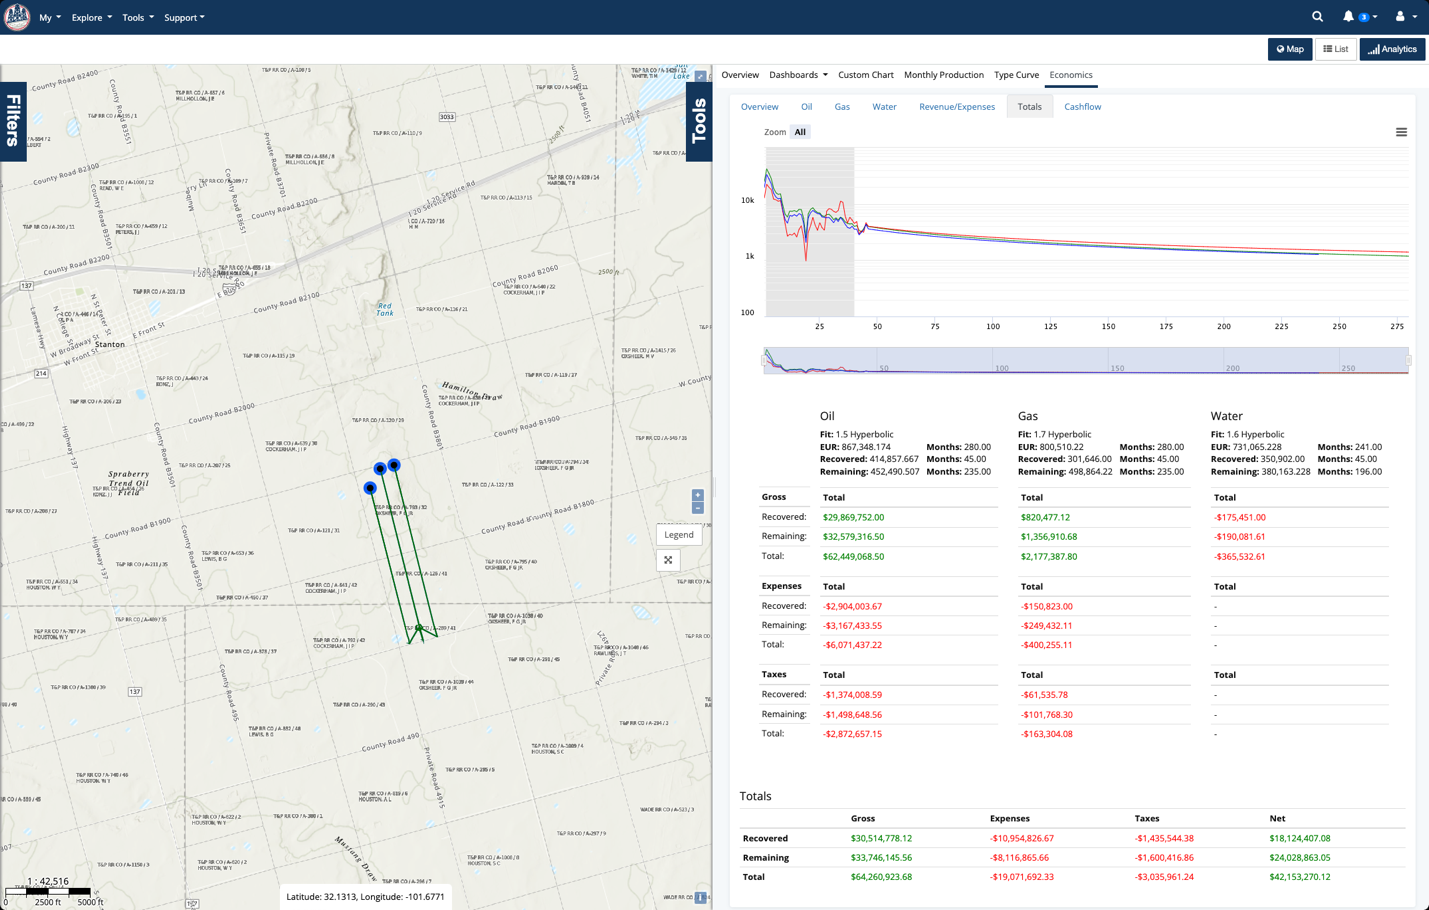
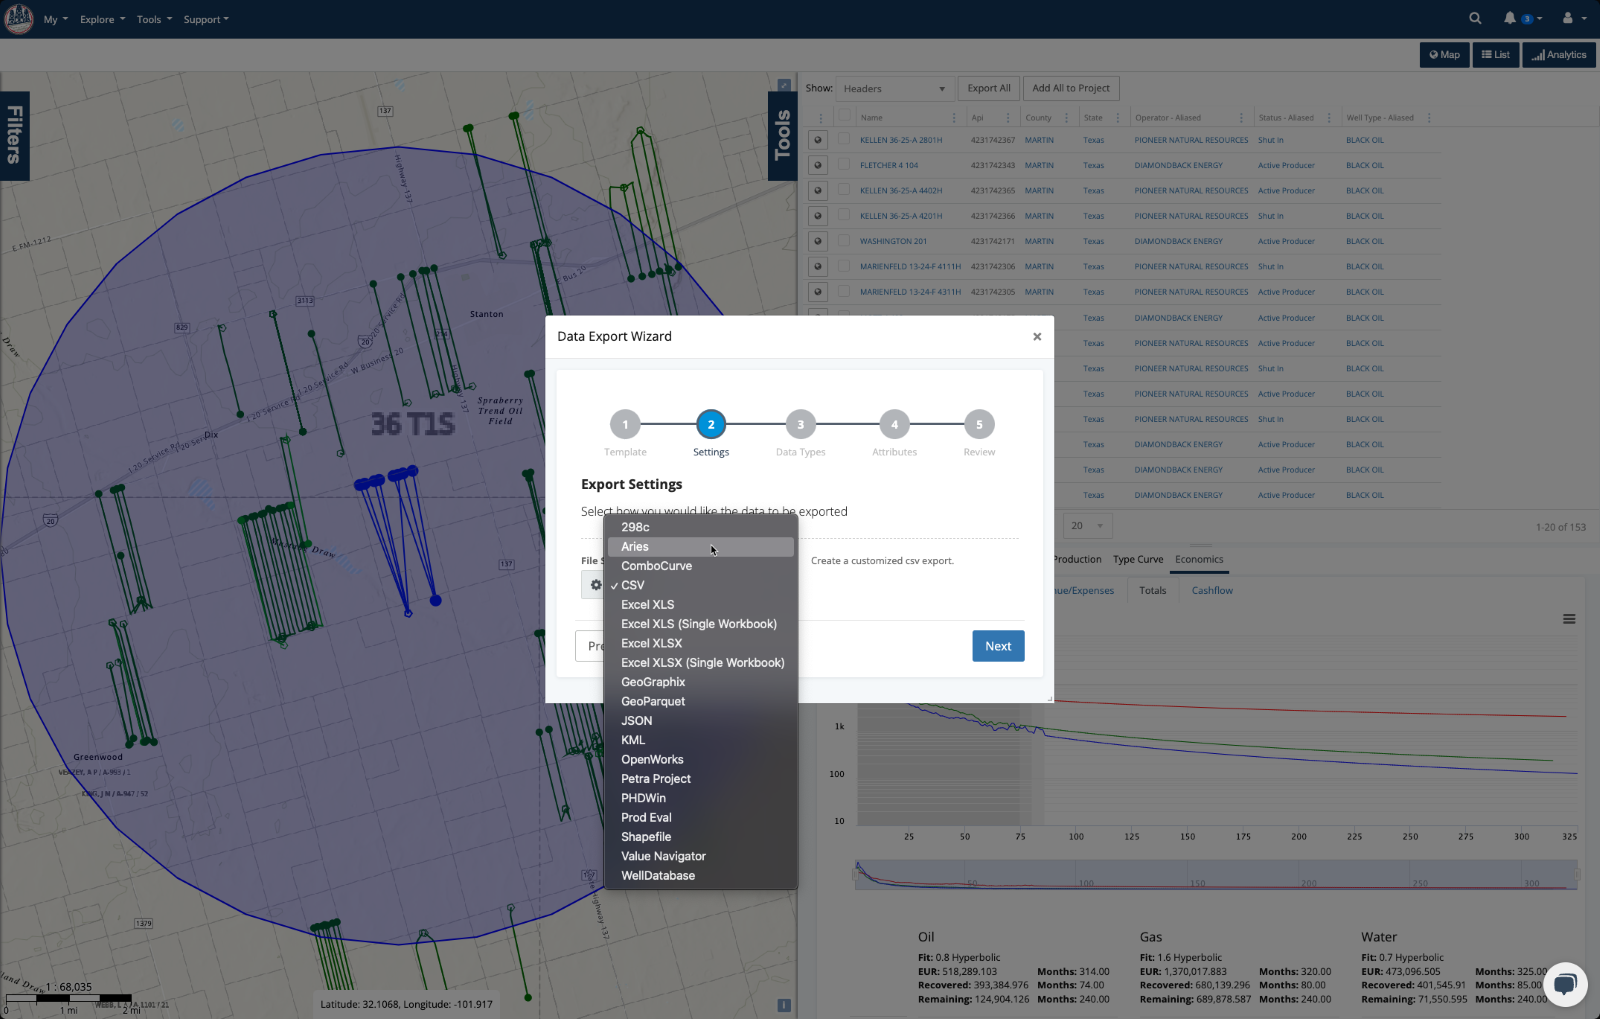
The opportunity looks promising, and it is time to send it on for deeper evaluation. When you're ready to share your findings, WellDatabase’s export system lets you quickly export thousands of rows into various formats like CSV, ComboCurve, PHDwin, GeoParquet, and more.
At WellDatabase, we take a different approach to problem-solving: leave behind your cumbersome licenses and long-term contracts. No more manual updates – we're here to revolutionize your work process, streamlining your workflow to be easier, faster, and more efficient.
So next time work intrudes on your vacation, remember WellDatabase is your secret weapon to tackle it quickly and return to that beach chair with a smile. Sign up now for the 3-day summer trial www.welldatabase.com/summer-trial and get started with your evaluation.
While writing up the post on comparing operators using DCA, we ran across a set of wells where the best fit didn’t exactly fit as well as we would...
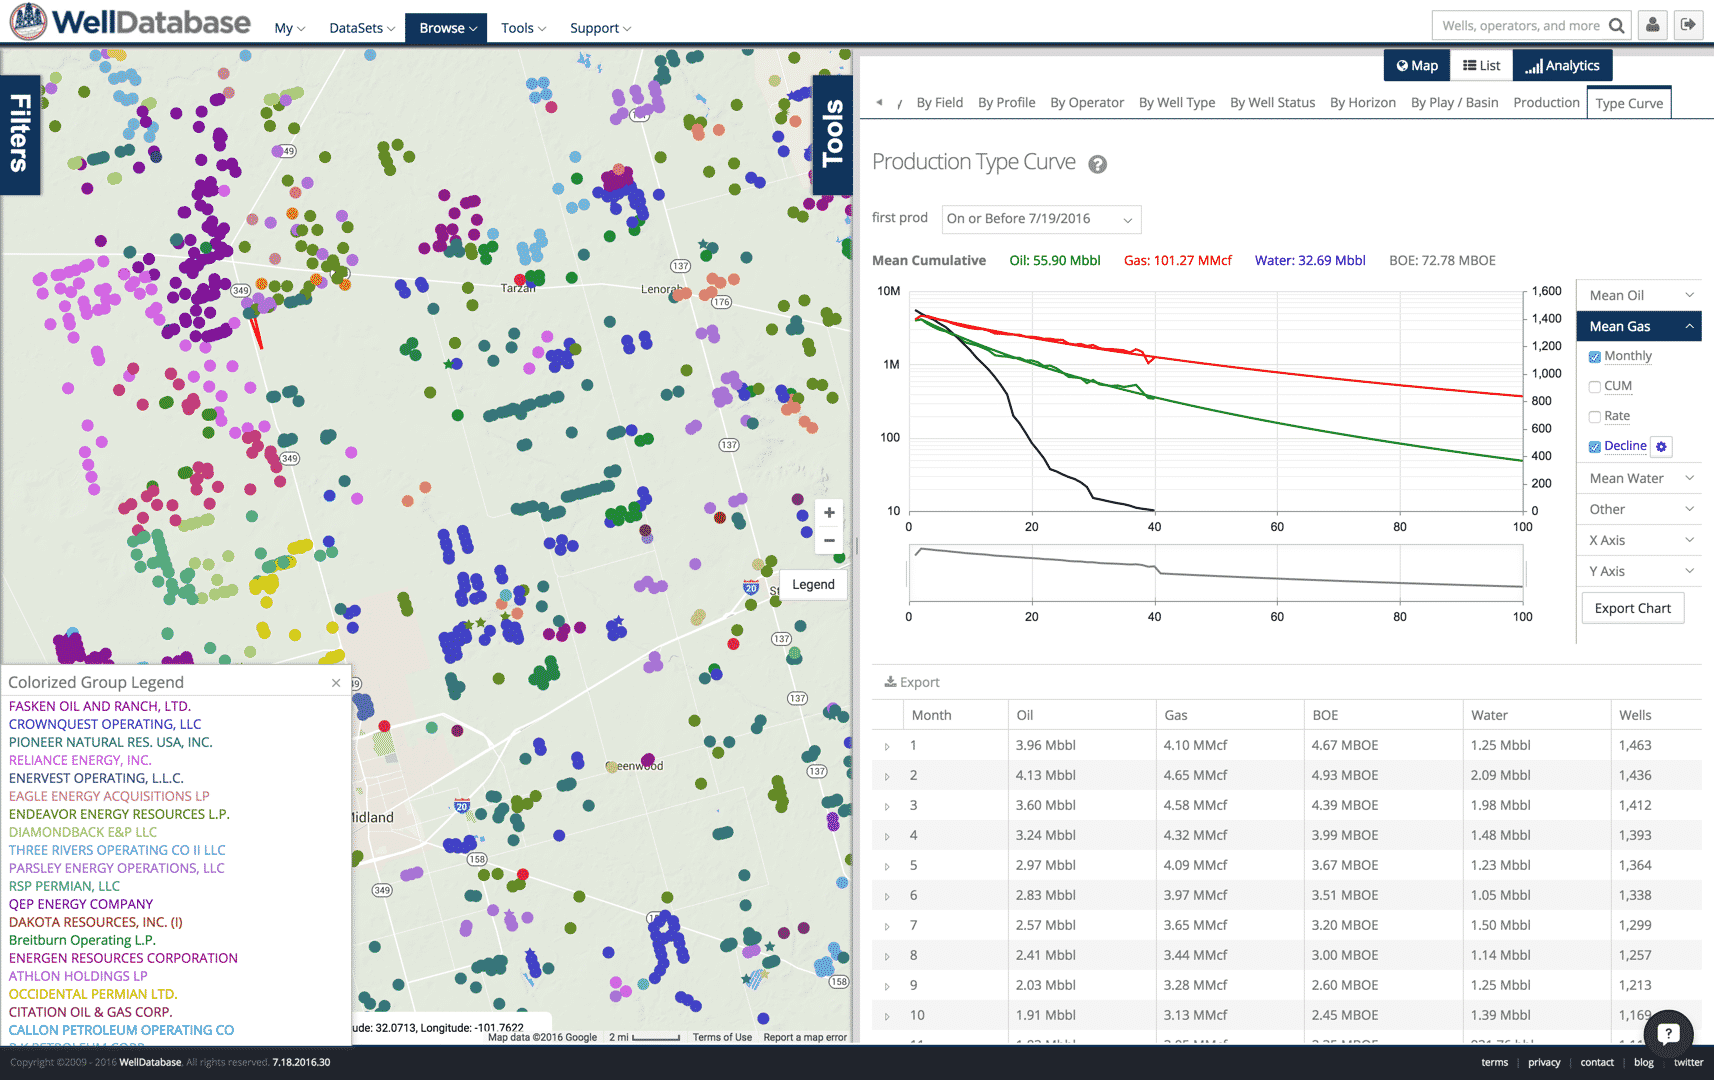
Creating a production decline curve is relatively simple. Creating one that makes sense can be more of a challenge. Fortunately WellDatabase’s best...
As a consultant or small business owner, you're either knee-deep in an existing project or on the hunt for your next big opportunity. While hustling...