2023 Completions Analysis: Trends and Insights Revealed
Continuing our 2023 recap series, it's time to discuss completions. If you missed the permit rundown, check that out here - 2023 Permit Activity Recap
You need data. You need mapping. You need tools to analyze that data. Now you can do everything in a single, easy to use platform.
Perfect for users who need access to basic well level data. If you're only interested in a few wells and currently use state sites, this plan is for you.
The industry didn't start with unconventionals and neither does our data. We cover the full historical dataset across every producing state and province. Don't settle for inferior data, check out our coverage for any state or province you're interested in.

3 min read
John Ferrell
:
Dec 21, 2023 11:17:37 AM
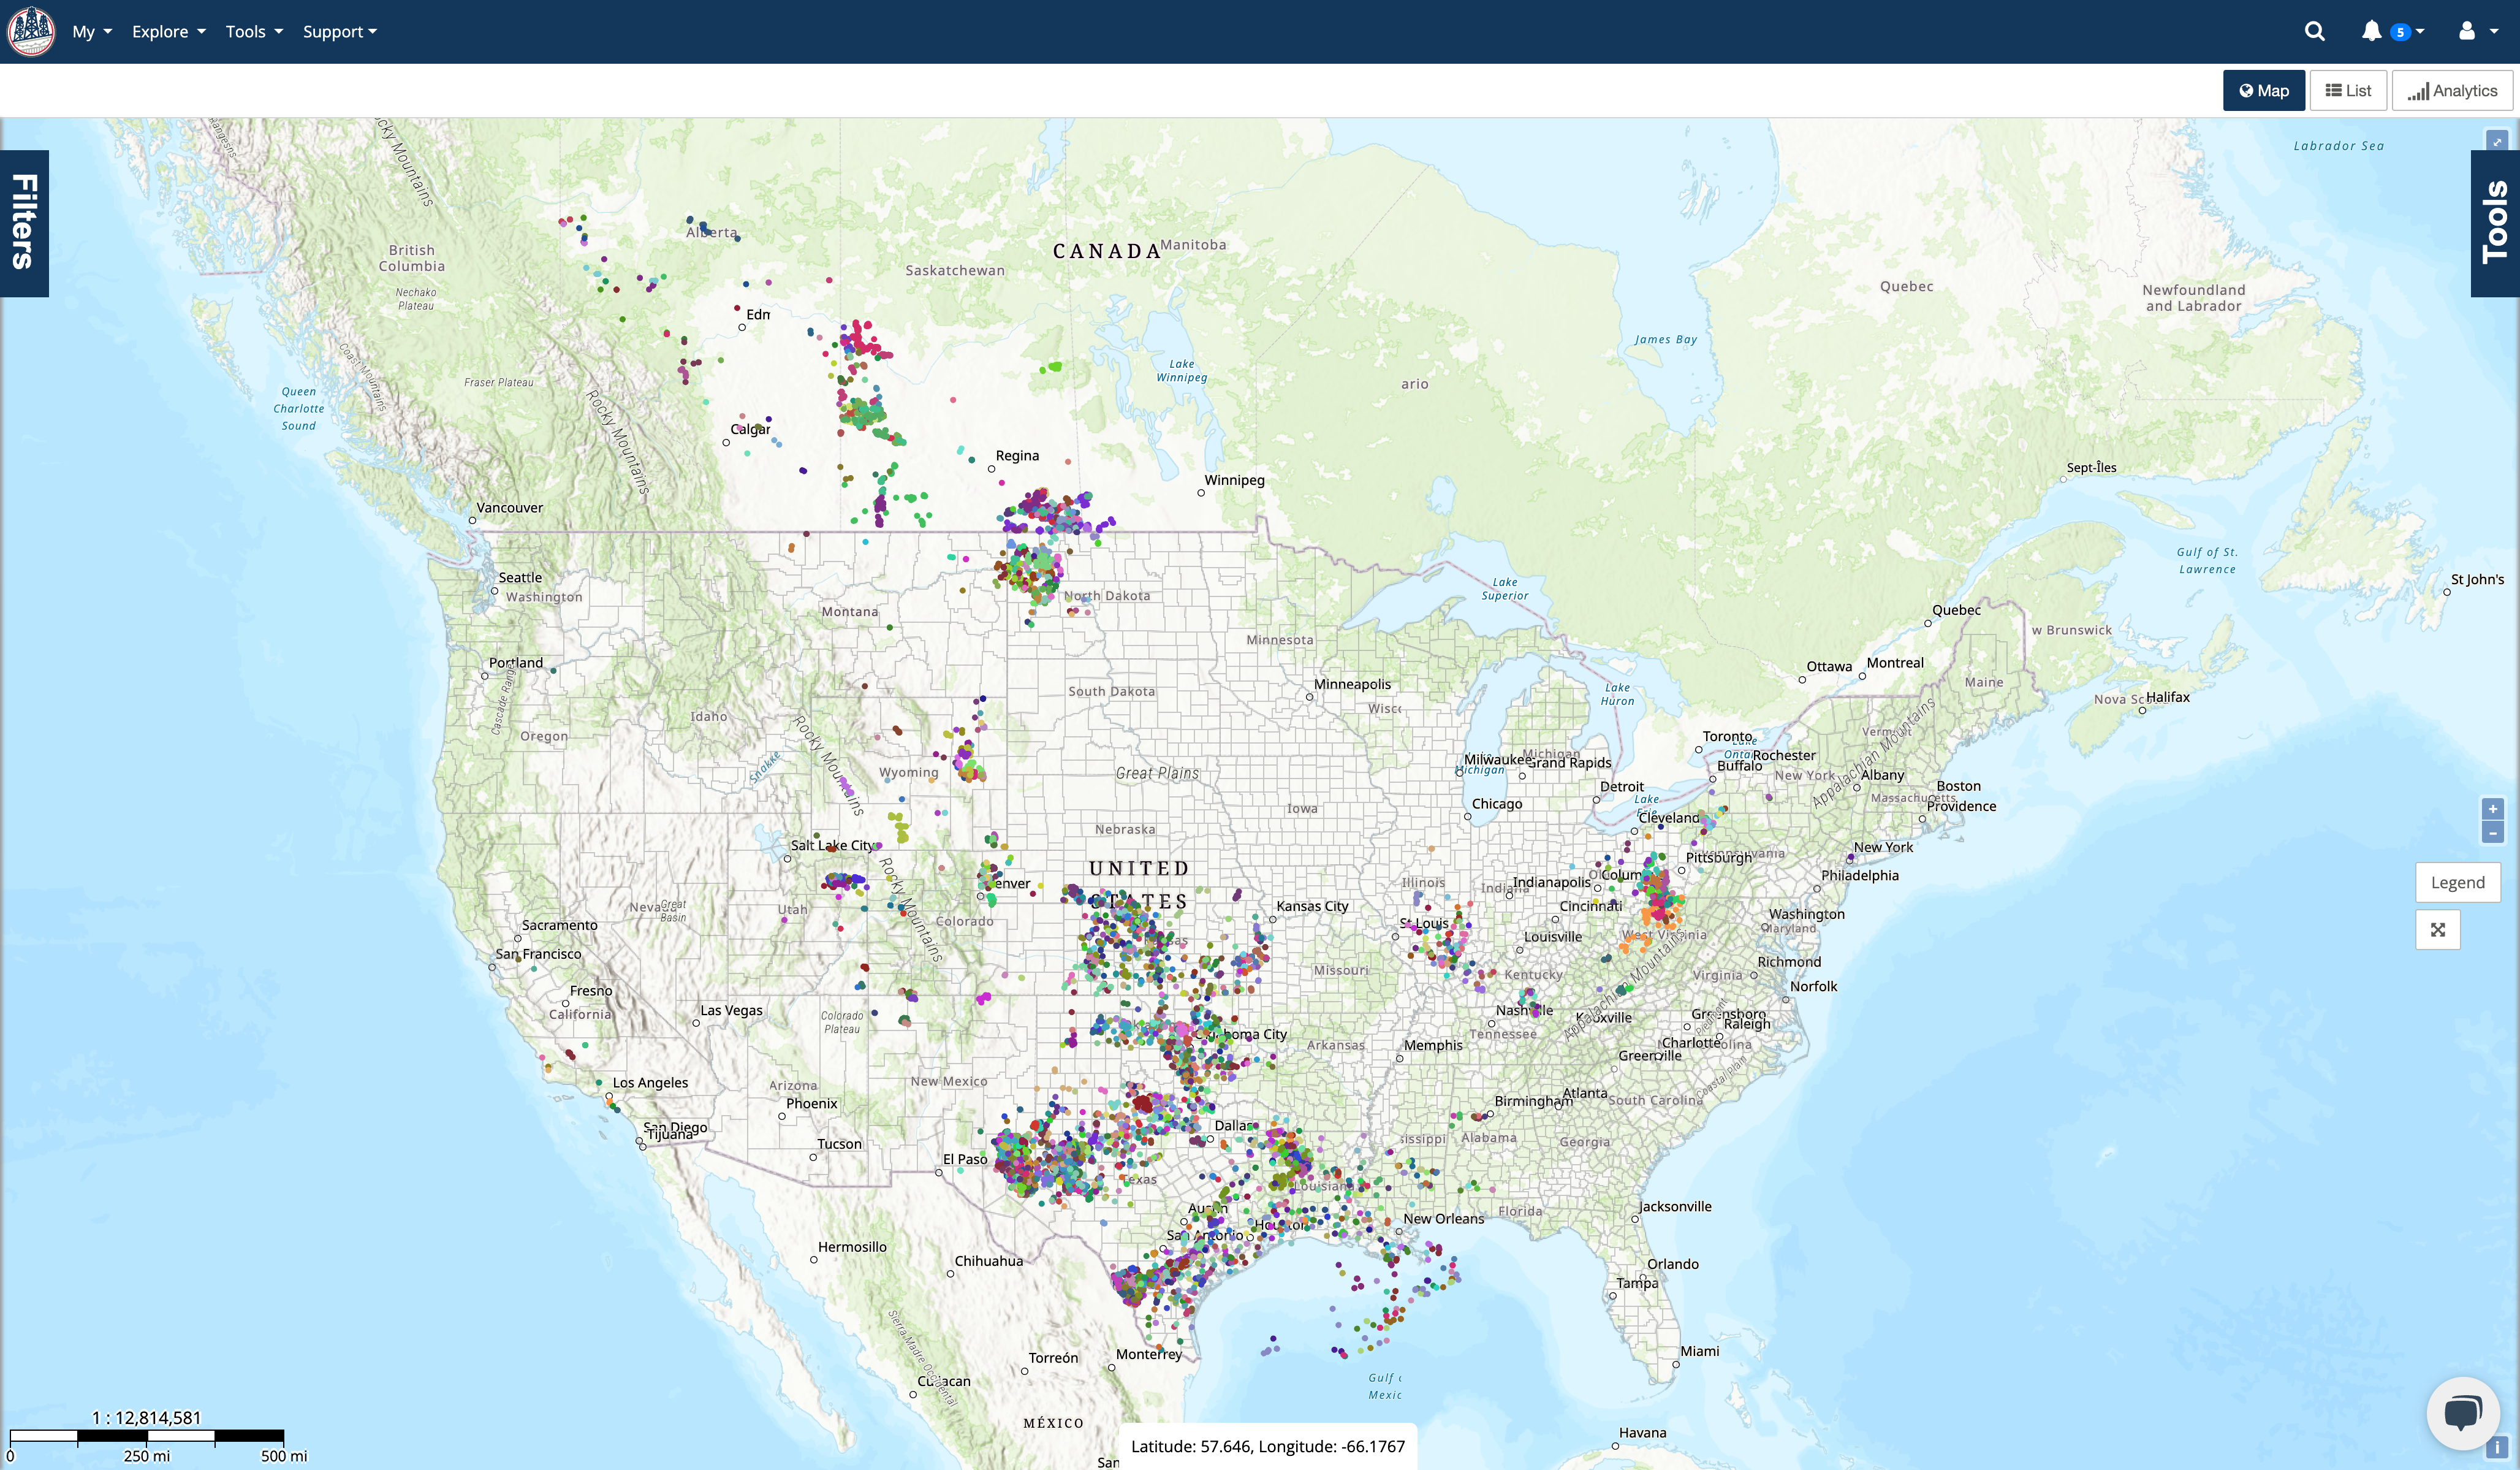
As 2023 ends, it's time to reflect on the year and the industry activity. What better way to start than to jump into permitting activity? Let's dive right in.
Here's the overall view of what 2023 permitting looked like:
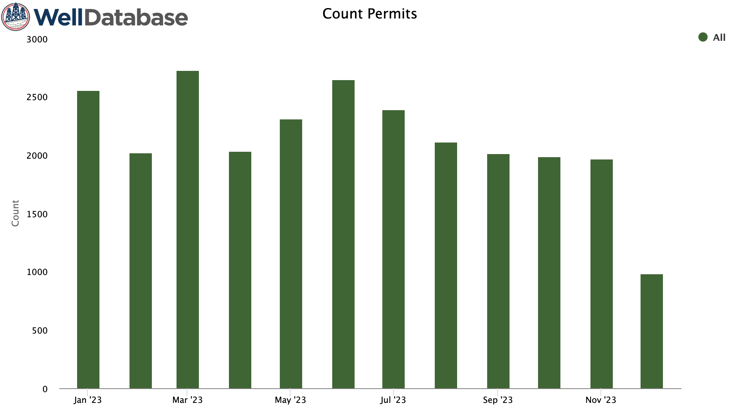
That adds up to 19,574 total permits filed. Broken down by basin, we get:
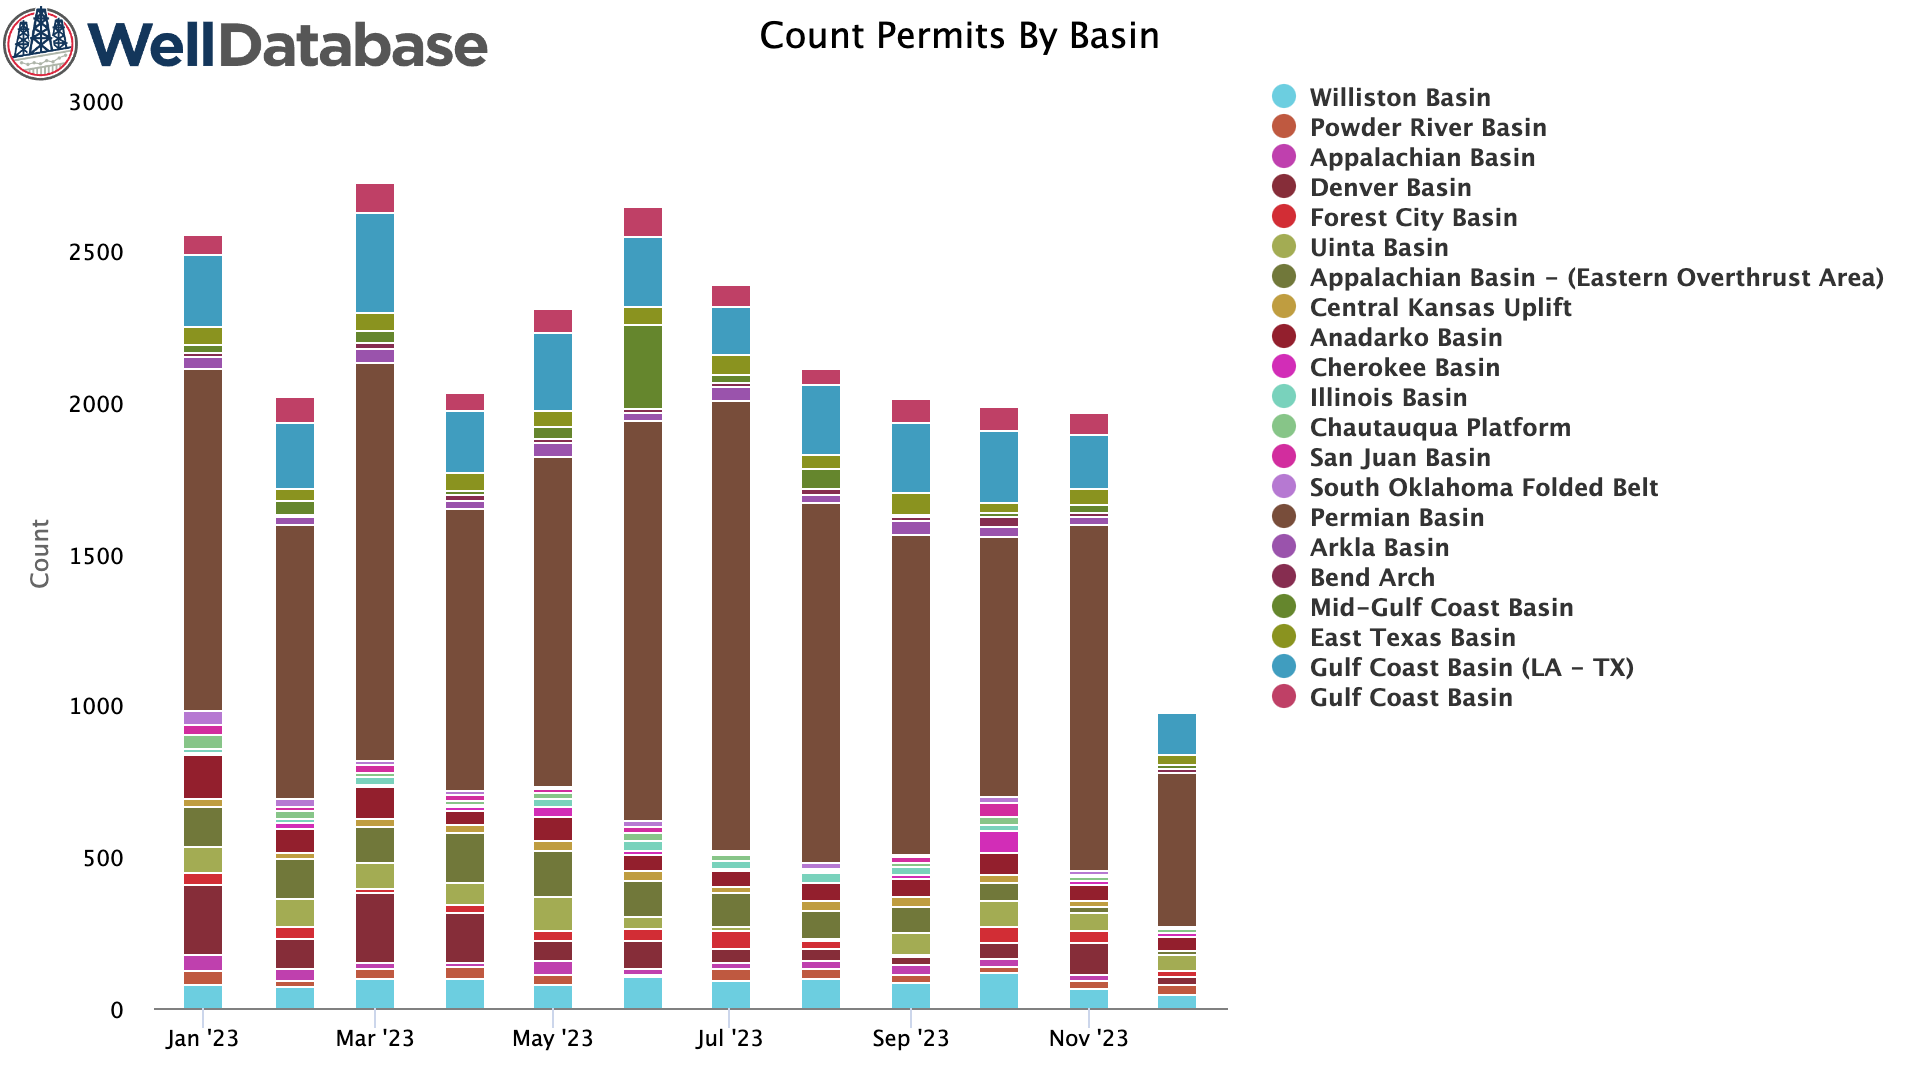
There are no real surprises here. The Permian continues to reign supreme over all other basins.
2023 saw over 400 operators file permits, which makes visualizing them all difficult. It is interesting to note that no single operator accounted for more than ~4% of permitting.
Here is the breakdown of the top 20 permitting operators:
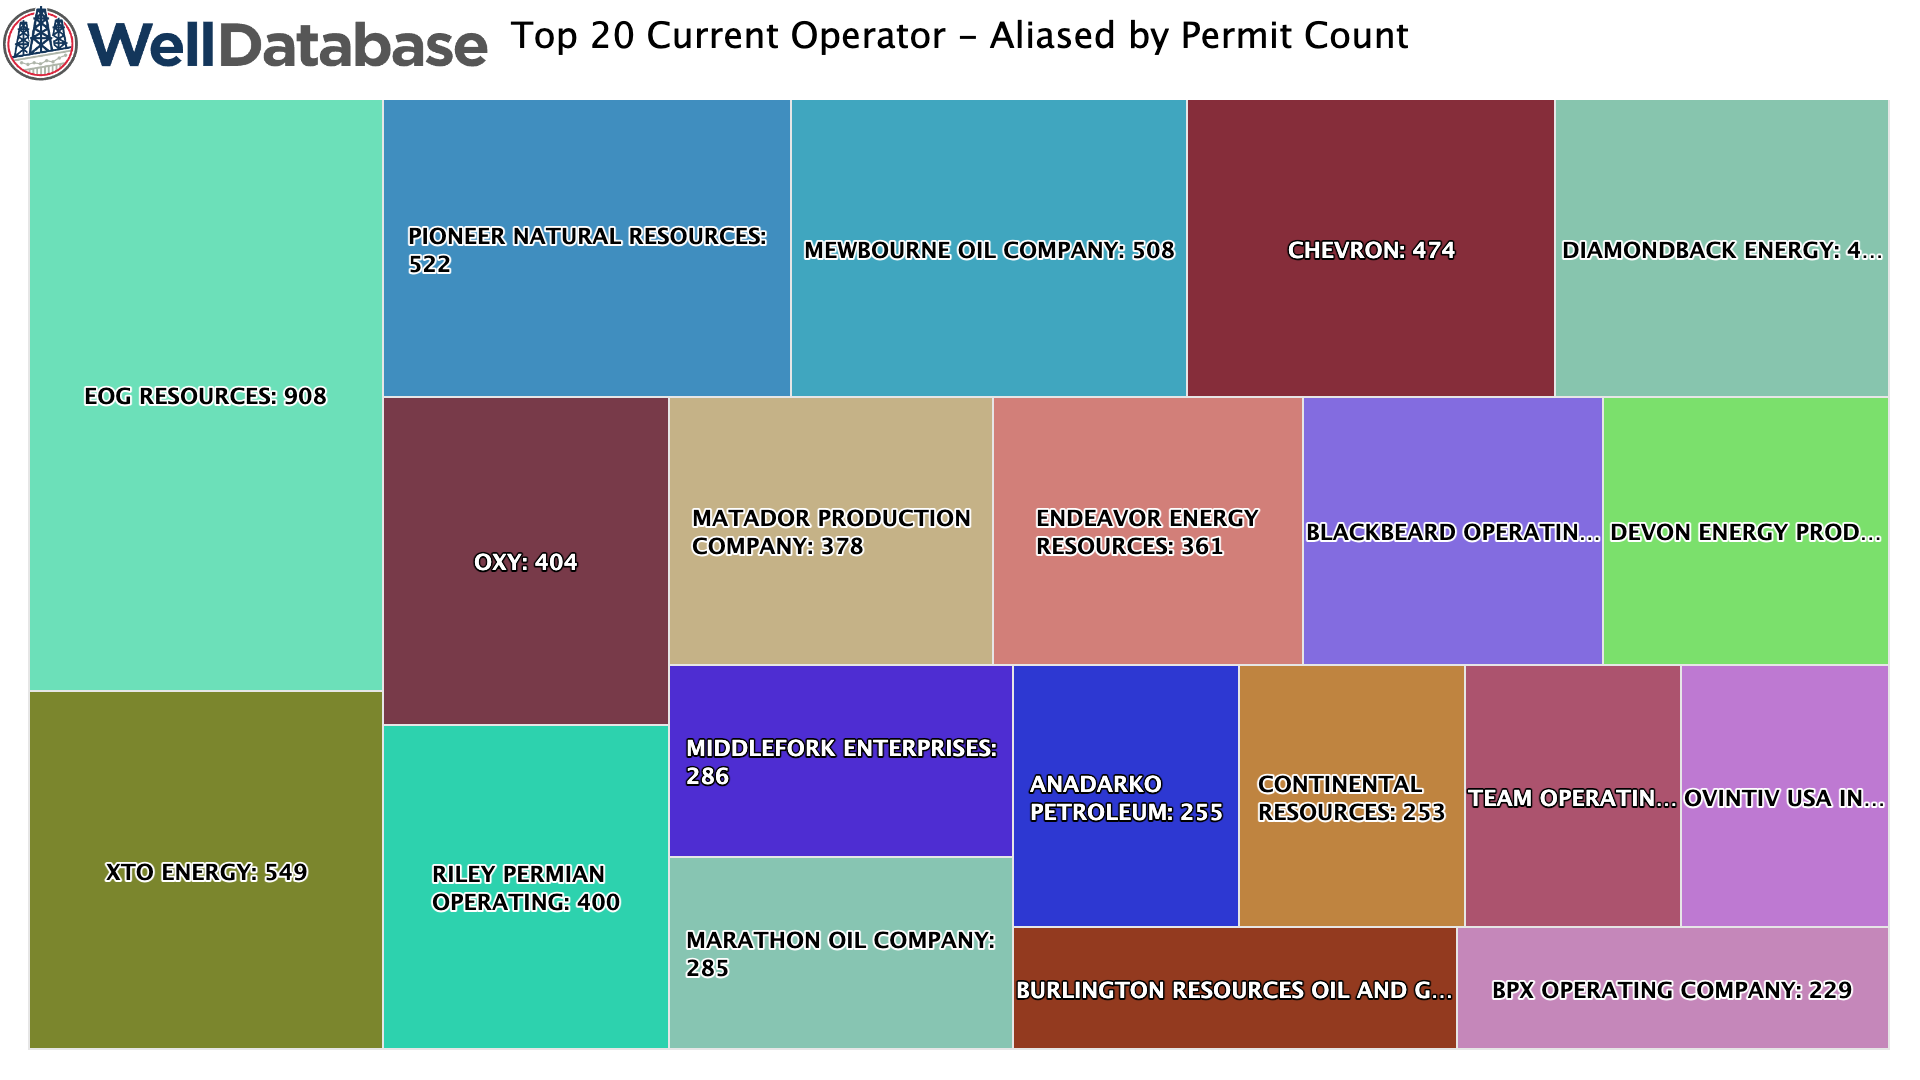
EOG is the clear leader in permitting this year, but the combined XTO & Pioneer permitting eclipses EOG this year. This is something to watch as we roll into '24 and that acquisition is finalized.
Another interesting note is that when you take the top 20 permitting operators by basin, the percentage of activity in the Permian is nearly 3/4 of all permits.
.png?width=740&height=416&name=top-20-basin-by-permit-c%20(2).png)
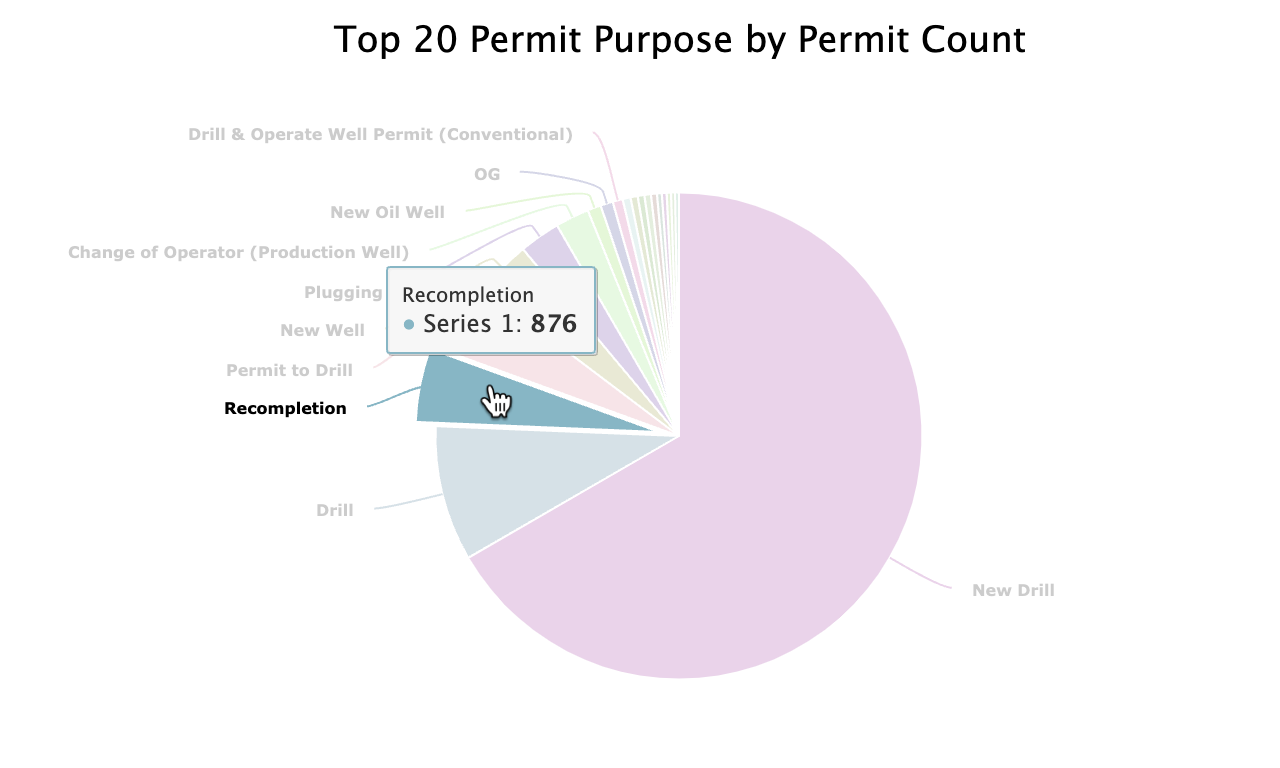
While permitting activity is one of the leading indicators of activity in the industry, it is important to note that permits are filed for many different reasons. There are a couple of ways to break this down. The first is by the permitting purpose. Most permits filed every year are indeed for new drills. However, Recompletion permits accounted for 876 total permits.
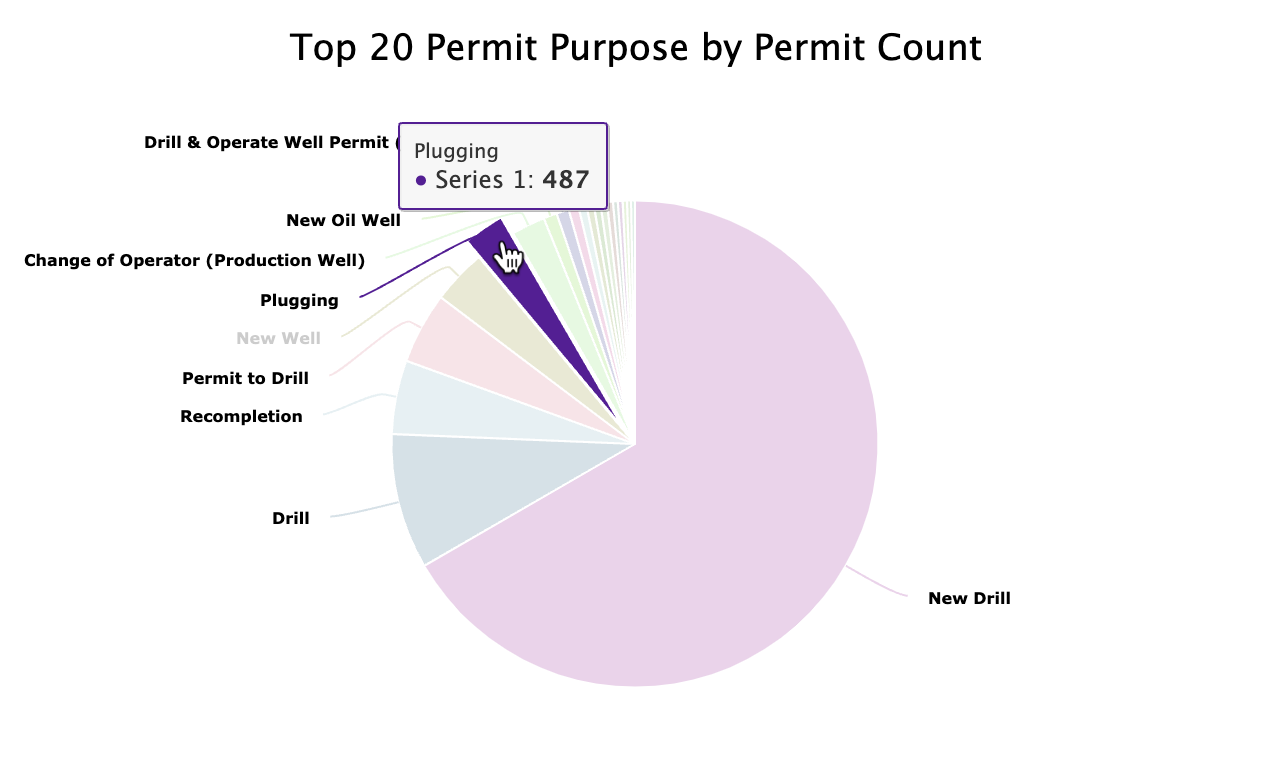
Plugging permits account for 487 of those permits as well.
Beyond the permitting purpose, it's also interesting to break down the permits that led to new production. In 2023, only 1,694 of those permits resulted in production being added. This number is preliminary, as production to date does not include anything from Q4.
Here are the top 20 operators, by count of wells permitted and producing in '23:
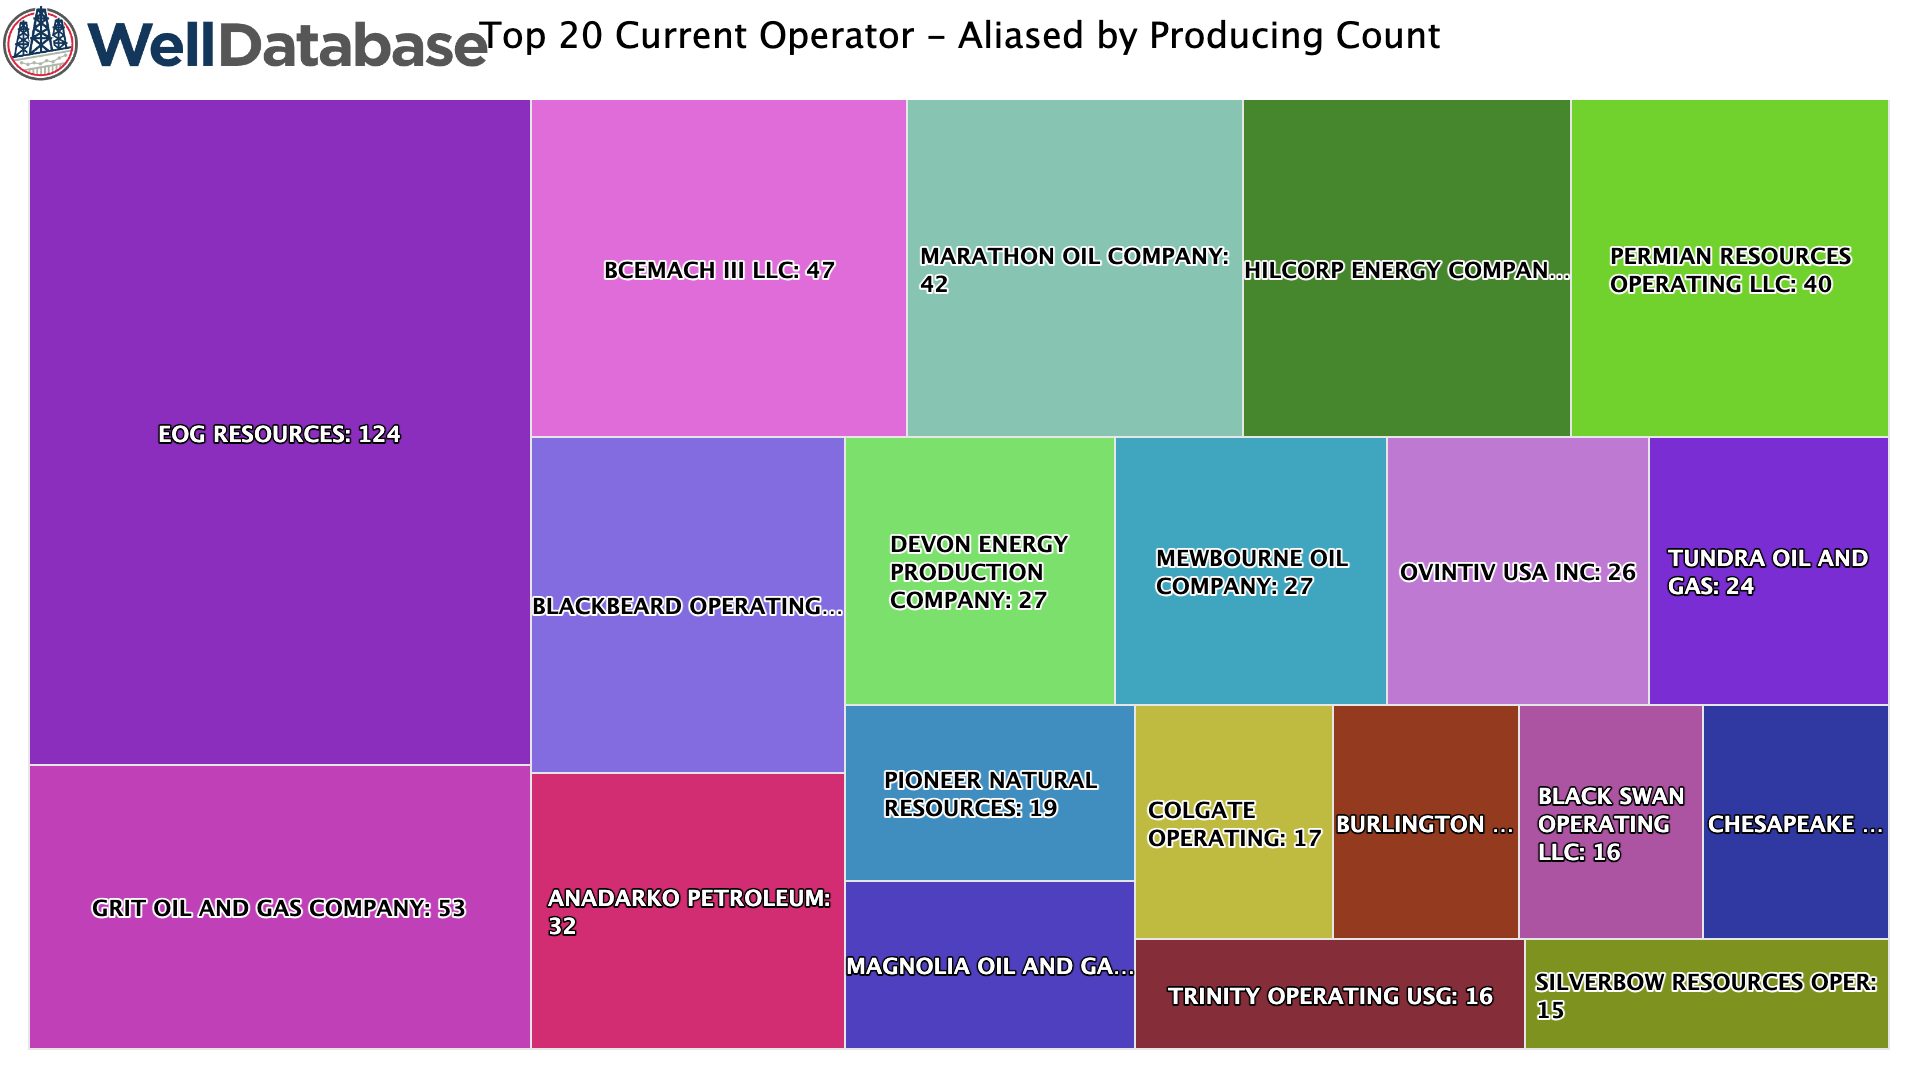
The data here is too new to pin any trends on which operators are permitting to produce vs permitting to hold lease or other reasons.
Overall, we have seen an interesting downward trend in days from permit to production.
.png?width=3840&height=2160&name=average-days-from-permit%20(4).png)
This does make sense as the industry has evolved and focused more on efficiency than ever. This overall trend of production coming online close to permitting dates is beneficial since we can more easily forecast new wells. Remember that the chart will trend downwards as we get closer to today's date. This is because it only measures wells that have come online and does not account for wells that have been permitted in recent years and have not come online.
For reference, we have had over 134,000 permits filed since 2018, and nearly 74,000 of those have started production. That's almost half of all permits in the past 5 years that were never produced. It sounds like another blog about that is in order. That said, you can still see a downward trend in days from permit to production when you back out to 2000 (and a fun spike in 2020).
.png?width=3840&height=2160&name=average-days-from-permit%20(5).png)
Taking a step back from 2023 alone shows some expected but interesting trends.
Twenty-three years is a long time, but the trend in permitting is interesting.
.png?width=3840&height=2160&name=count-well-count-vs-firs%20(1).png)
We can spot the booms and busts here, but the overall trend is fewer permits and fewer wells but more production (production trends coming soon).
When we dive into the past five years, we gain more clarity on our current situation.
.png?width=3840&height=2160&name=count-well-count-vs-firs%20(2).png)
As expected, we're well down from 2018, but it has leveled off in the past few years. Ignoring 2020 (please, please do), we have been steady/flat in permitting activity.
Looking at the permits by top basins over the past 10 years, we see an overall trend like the above, but we also see an increase in permitting in the Permian.
.png?width=1920&height=1080&name=count-permits-by-basin%20(2).png)
Thanks to this fancy WellDatabase platform, we can break down permits as a percentage of the whole. This does a better job of showing how the Permian continues to grow its permit market share.
.png?width=1920&height=1080&name=count-permits-by-basin%20(3).png)
This is primarily interesting because the Permian has seriously taken over the activity in the industry. While we mostly knew that, it wasn't always that way.
While 2023 might seem boring, it aligns with an overall strategy in the industry to become more efficient. There were fewer permits and fewer rigs but more production. As someone who has worked through many booms and busts, I prefer this boring but steady environment. It has allowed operators to invest in people, technology, and returns. With the Fed appearing to be done with interest rate hikes and inflation stabilizing, I see this trend continuing through 2024. That is, of course, barring any global economic issues or conflicts. I don't quite have that crystal ball down yet.
Continuing our 2023 recap series, it's time to discuss completions. If you missed the permit rundown, check that out here - 2023 Permit Activity Recap

Understanding production patterns and identifying hotspots in oil and gas analytics is crucial for strategic decision-making. Here are some advanced...
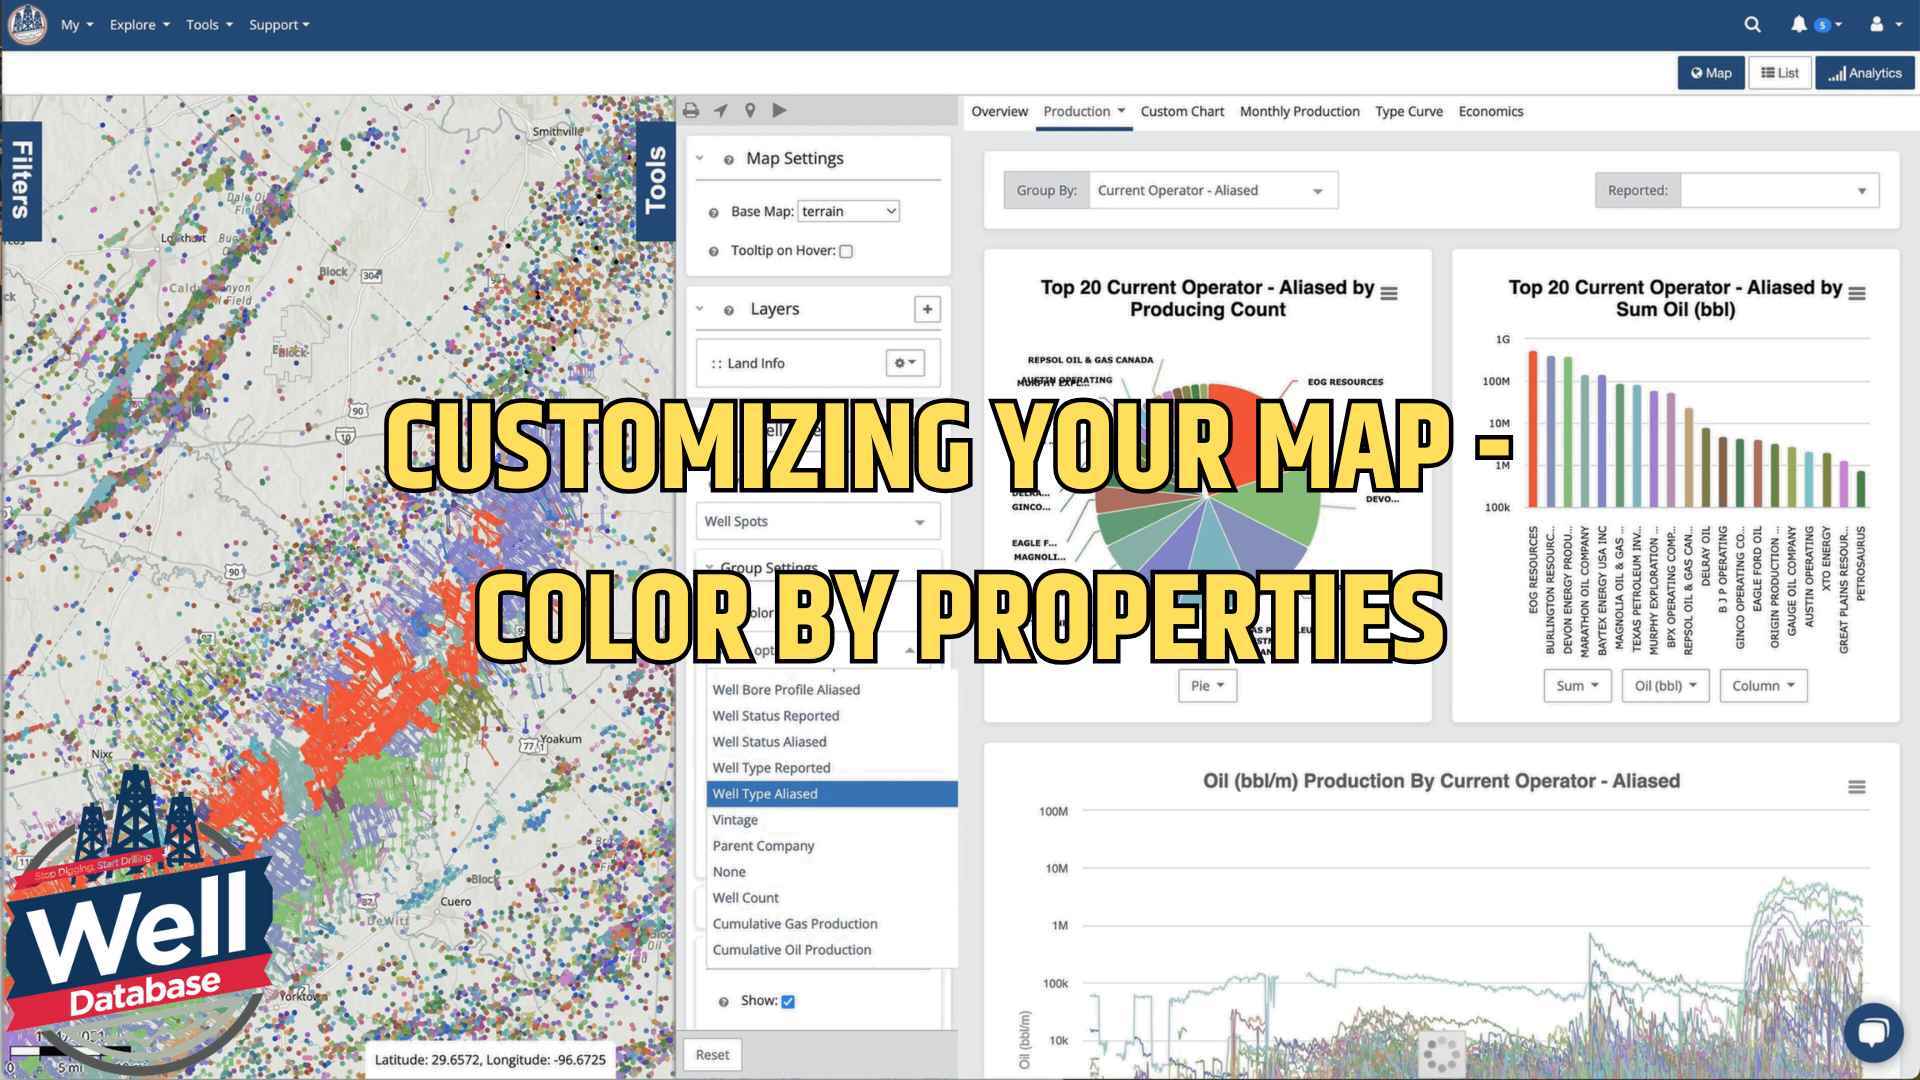
Let me introduce you to one of our most powerful yet user-friendly features: map color customization. Whether you're analyzing well locations,...