 John Ferrell
1 min read
The Effect of New Drills
So laying down rigs is a pretty popular idea. Makes sense. If you stop drilling, you slow your production. It’s also one of the easiest cuts to be...


The industry didn't start with unconventionals and neither does our data. We cover the full historical dataset across every producing state and province. Don't settle for inferior data, check out our coverage for any state or province you're interested in.

After much fanfare, we are now arriving to the biggest question. What does it look like to shut in wells? How do they come back? What are the pros and cons? This will be fun…
Before we dive in, feel free to check out the other posts in this series.
The Problem…The Whole Problem
The Effect of New Drills
Choking Back Wells
Completion Activity
In the previous blogs we took a dive into how new drills and completions affect production. Both can help by not bringing new production online and letting the existing production continue to decline. Shutting in wells is the only way to actively subtract production from entering the market. So let’s get started.
This post will focus primarily on the production effects we can measure using the data we have. There are other potential side effects of shutting in wells. One notable issue that has been brought up here is ESPs (with some colorful solutions…I like). If you have to pull an ESP to shut in a well, then you will obviously have to weigh that out. It’s pretty universal that we want to see cuts, but are you really going to pay cash out of your pocket to make it happen?
With all the talk about shutting wells in, the idea was presented that you don’t just shut in 20% of your wells and leave them that way. You rotate your shut-ins among all of your wells, ~2 weeks at a time. I can’t take credit for the idea. David Ramsden-Wood said it to me in a LinkedIn reply here. Honestly, it was one of those moments when you say to yourself, “damn, that might work”.
As a matter of fact, we have lots of examples of this. It is common for operators to shut in neighboring wells while fracing. Let’s look at a few examples.
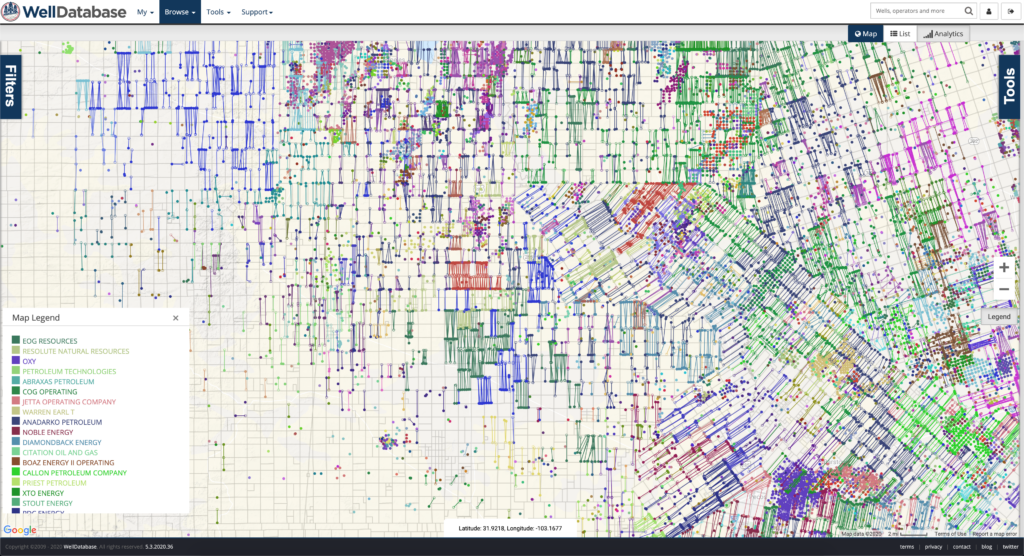
Example #1, Cimarex in Culberson County, TX
Finding these examples isn’t too difficult. I did make sure to grab wells from a single operator where there was a noticeable dip in production prior to new wells coming online.
If you want to follow along, here’s a link to the search – https://app.welldatabase.com/Browse/Public/Index/4K11q
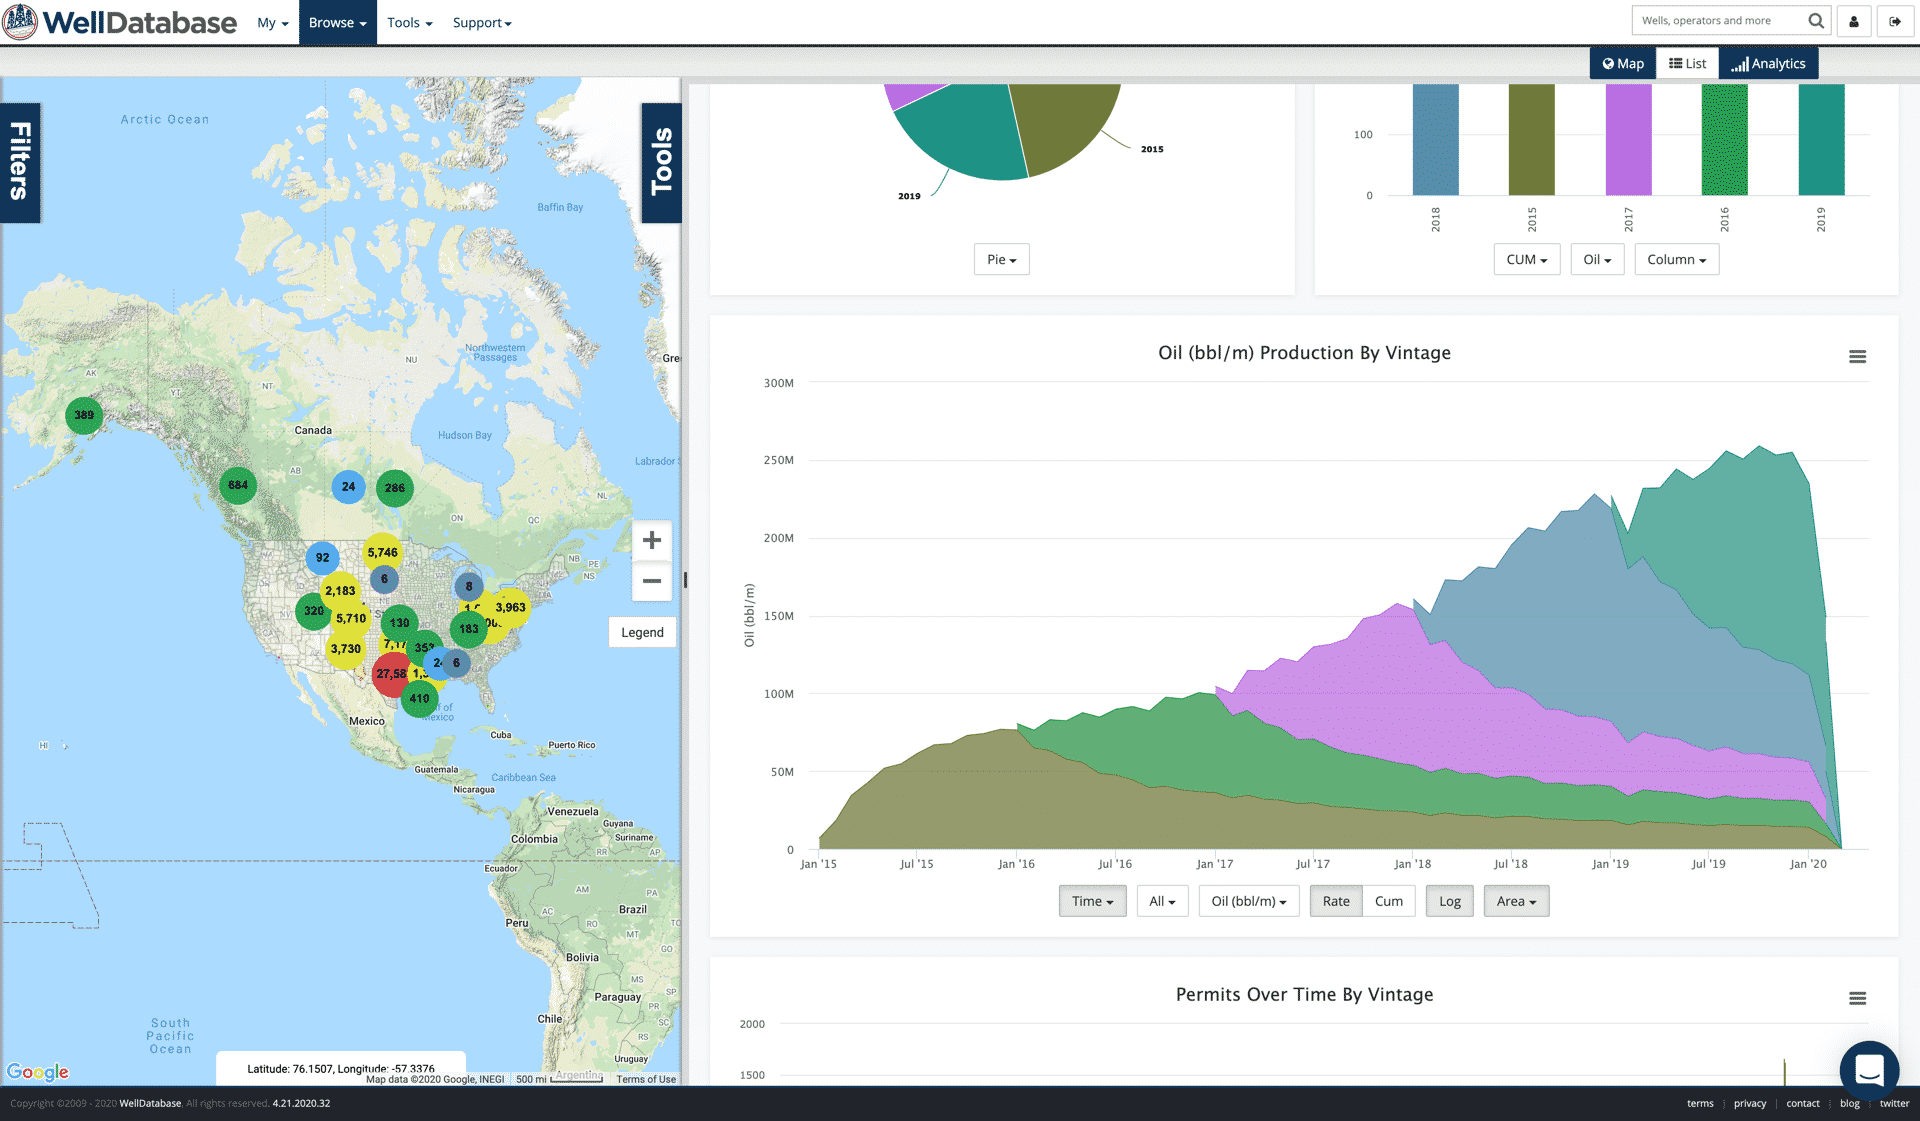
Here’s a look at the wells and the production in a stacked area chart.
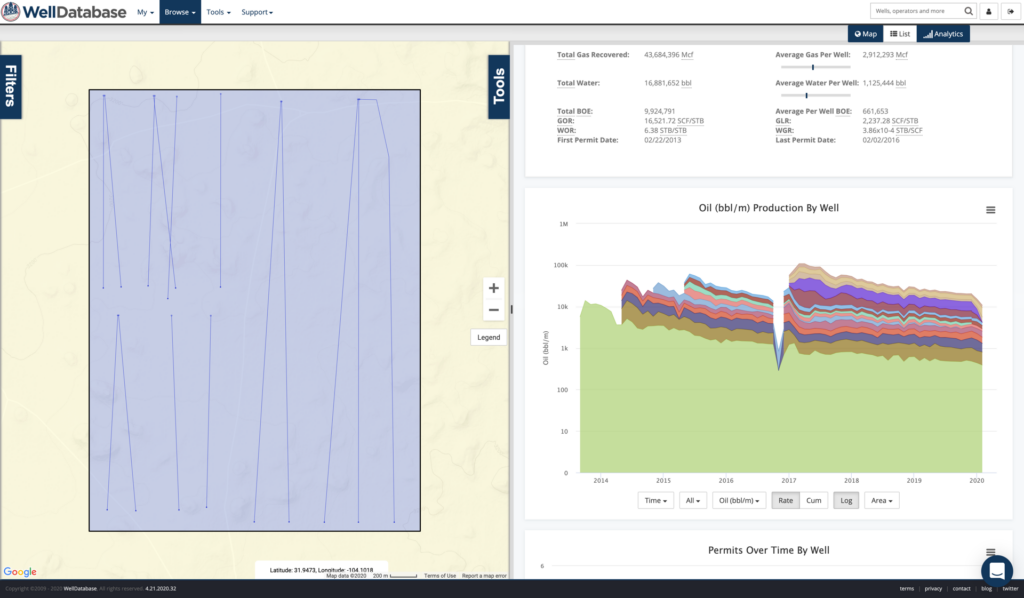
That’s not dramatic enough. Let’s knock off the log scale and see what it looks like.
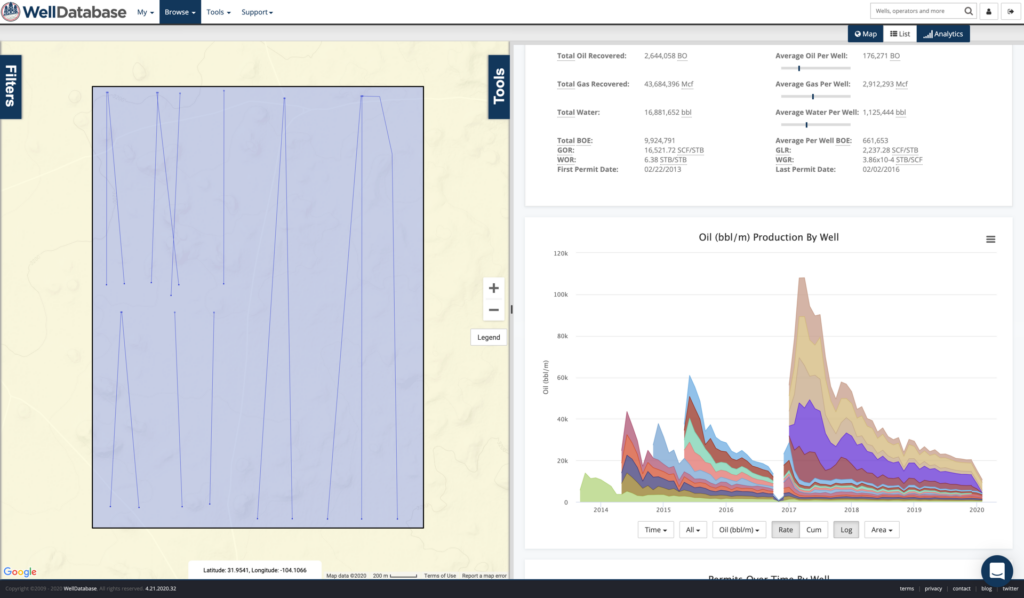
That’s better. Before you start thinking about lease production and allocation, each of these wells are technically classified as gas wells and therefore are each on their own lease. The GOR on these wells ranges from 9-27 (MCF:BBL), so calling them gas wells is questionable, but not completely unreasonable. But I digress…
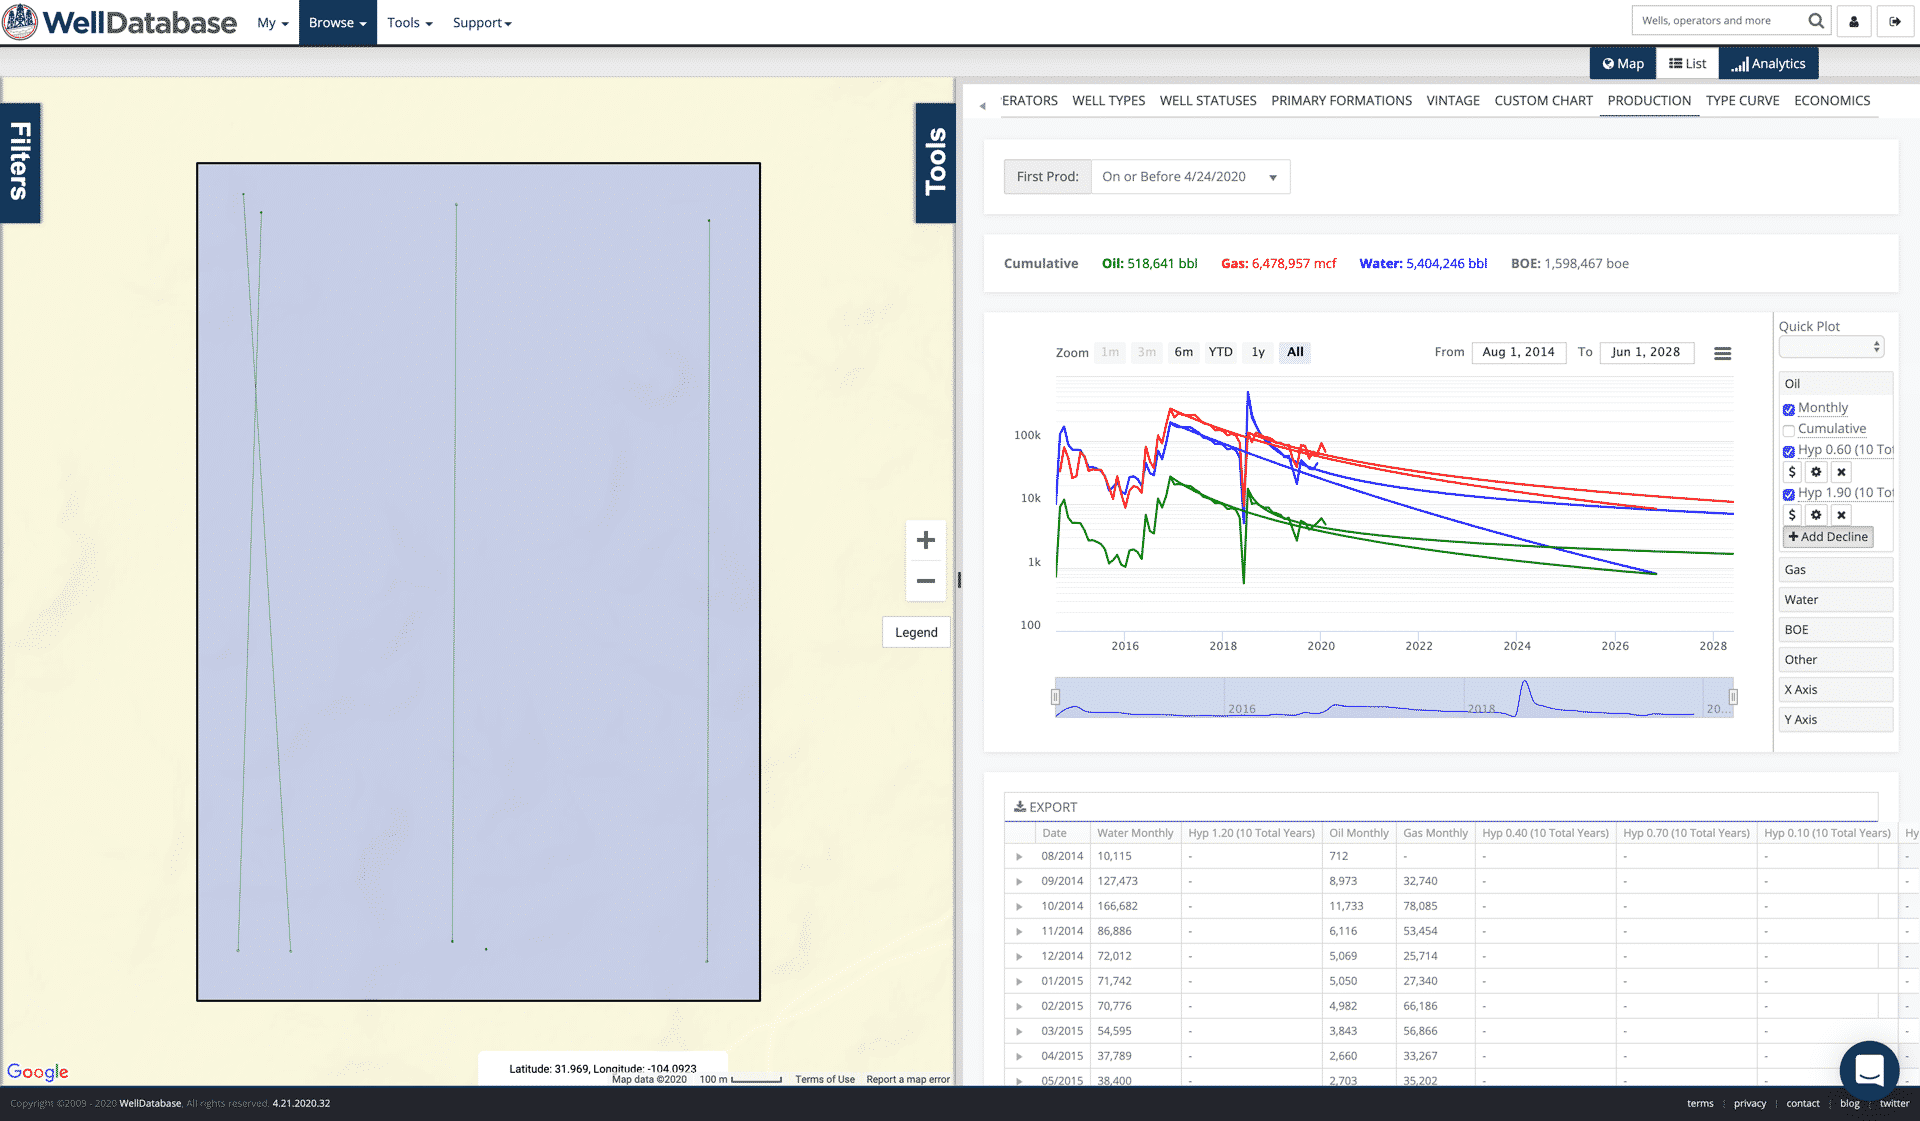
Off hand, things look pretty good. If we take the existing wells and forecast a decline on the whole it looks like this.
Quick note – water production is calculated in TX. We use water cut information from test data to guide the model that creates this water production value.
You can see that the production dips below the decline, raises above the decline, and settles in relatively close. Now let’s create a new decline set based on the production post shut-in. Luckily, WellDatabase lets us create multiple declines and compare.
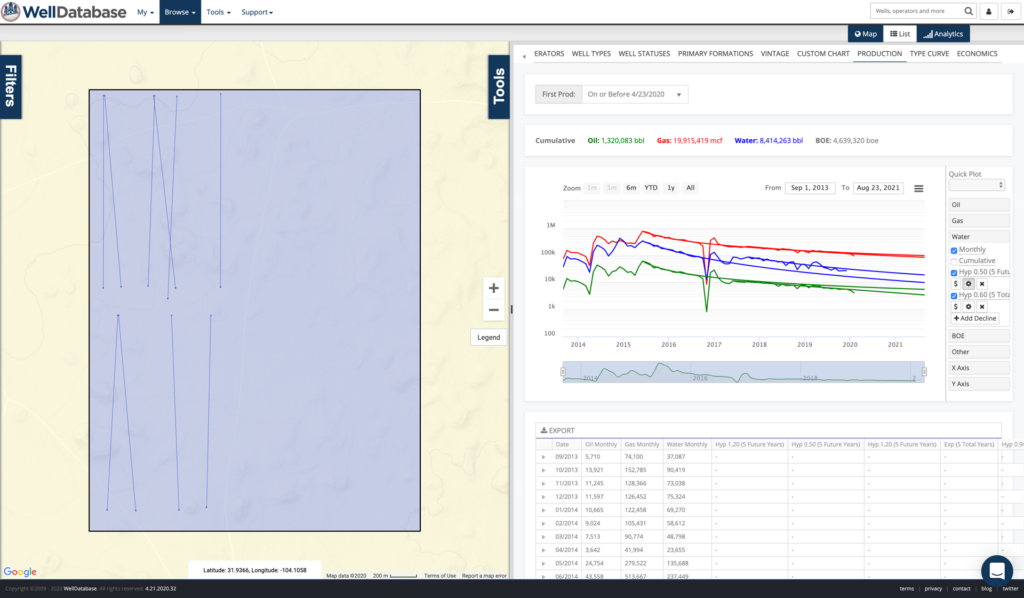
The fit definitely changes. Here’s is what we see.
| Fit Pre Shut-In | Fit Post Shut-In | |
| Oil | Hyperbolic 1.2 | Exponential (3.5%) |
| Gas | Hyperbolic 1.2 | Hyperbolic 0.9 |
| Water | Hyperbolic 0.5 | Hyperbolic 0.6 |
I don’t think we can put too much into the water jump. At the point where water increases, these wells have been online for as much as 45 months. WOR movement overtime in shale plays is a blog for another day.
We do see a smallish dip in decline fit. This isn’t too bad though. The forecast for the month of December, 2021 (exactly 5 years after the shut in) shows a decrease in oil of 2,169 bbls. This is over 10 wells, so that is 217 bbls per well on average or ~7 bbls per day per well. Gas difference is 13,430 MCF total, 1,343 MCF/Well, and 422 MCF/well/day. Does that matter? Maybe not.
Let’s also look at the cumulative production on the period of time in which the wells were shut in. What we’re really looking for here is how long did it take the wells to gain back what they lost in production when they were shut in.
Nearly every example we find has this “bounce-back effect”. Let’s quantify what this amounts to.
| Date | Actual Oil Production | Forecasted Oil Production (Hyperbolic 1.20) |
Oil Diff | Oil Net |
| Sep-16 | 17,117 | 17,847 | 730 | 730 |
| Oct-16 | 13,508 | 17,117 | 3,609 | 4,339 |
| Nov-16 | 834 | 16,449 | 15,615 | 19,954 |
| Dec-16 | 23,118 | 15,837 | -7,281 | 12,673 |
| Jan-17 | 28,579 | 15,272 | -13,307 | -634 |
| Feb-17 | 15,259 | 14,750 | -509 | -1,143 |
If you look at the net, you’ll see that the deficit created by the shut-in is indeed erased 2 months after the shut in occurs. This is all based on a decline fit that over the first 16 months of production shows a +/- 3 bbls oil/day/well margin of error.
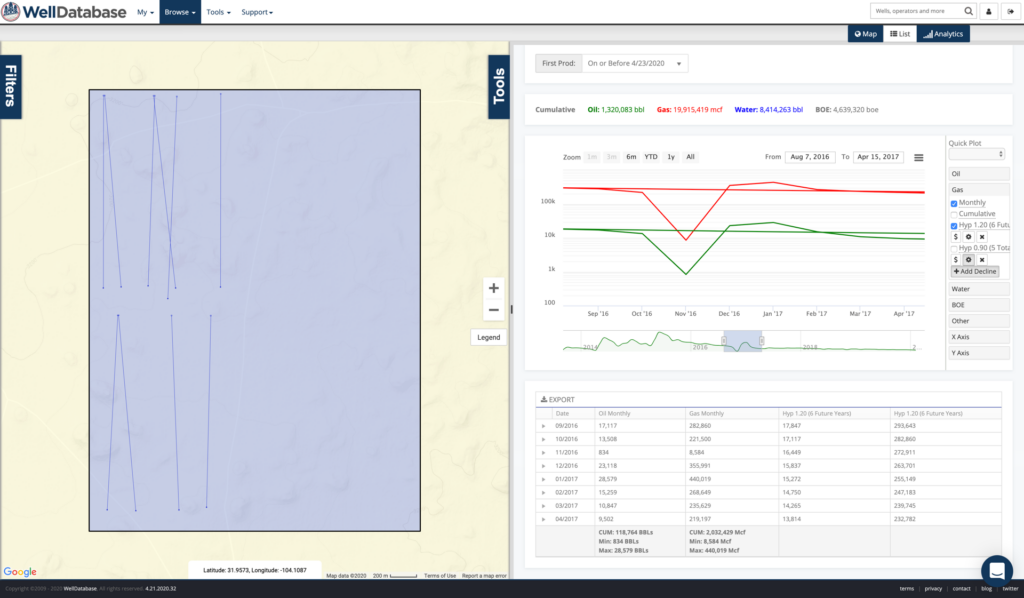
Now the gas production.
| Date | Actual Gas Production | Forecasted Gas Production (Hyperbolic 1.20) |
Gas Diff | Gas Net |
| Sep-16 | 282,860 | 293,643 | 10,783 | 10,783 |
| Oct-16 | 221,500 | 282,860 | 61,360 | 72,143 |
| Nov-16 | 8,584 | 272,911 | 264,327 | 336,470 |
| Dec-16 | 355,991 | 263,701 | -92,290 | 244,180 |
| Jan-17 | 440,019 | 255,149 | -184,870 | 59,310 |
| Feb-17 | 268,649 | 247,183 | -21,466 | 37,844 |
We aren’t quite as lucky here. We end up about 37,844 MCF short. Don’t forget, this is over 10 wells. So we’re talking about 3,784 MCF / well and 135 MCF / well / day. A couple months ago, I might have said the drop in gas was welcome. I’m not sure at this time…
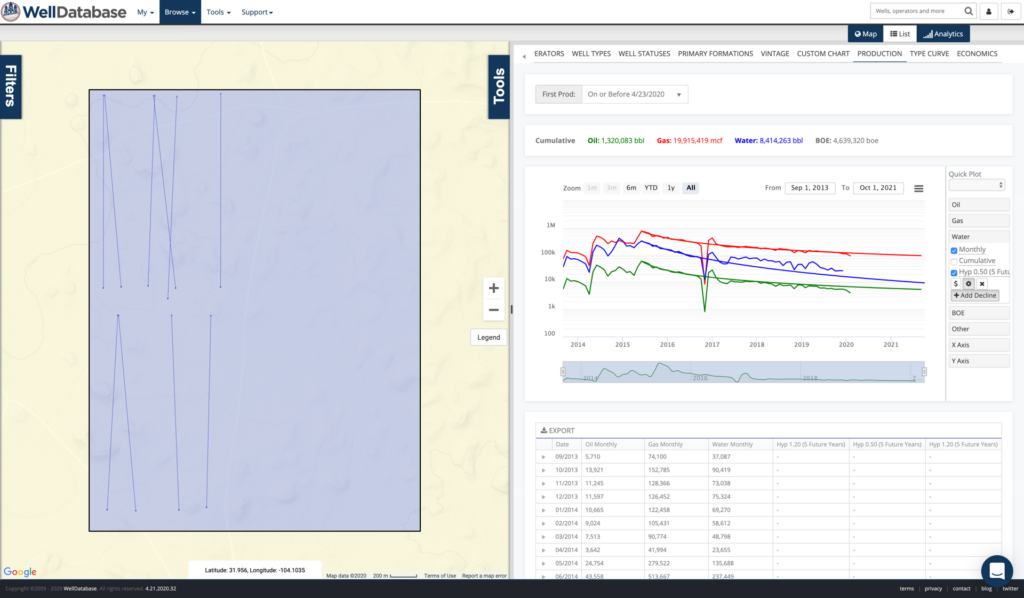
Last bit for this example is the cumulative difference over time. We’ve created forecasts for this set of wells both pre shut-in and post shut-in. Here is what the cumulative curve per well looks like.
That’s a grand total of 7,500 bbls difference over the course of 16 years. Does that matter? Fortunately for me, I don’t have to make that decision.
As for gas.
We actually see an increase in the cumulative here by 94,000 MCF / well on average. Again, wasn’t a good thing just a few months ago, but we’re talking over 21 years for this forecast.
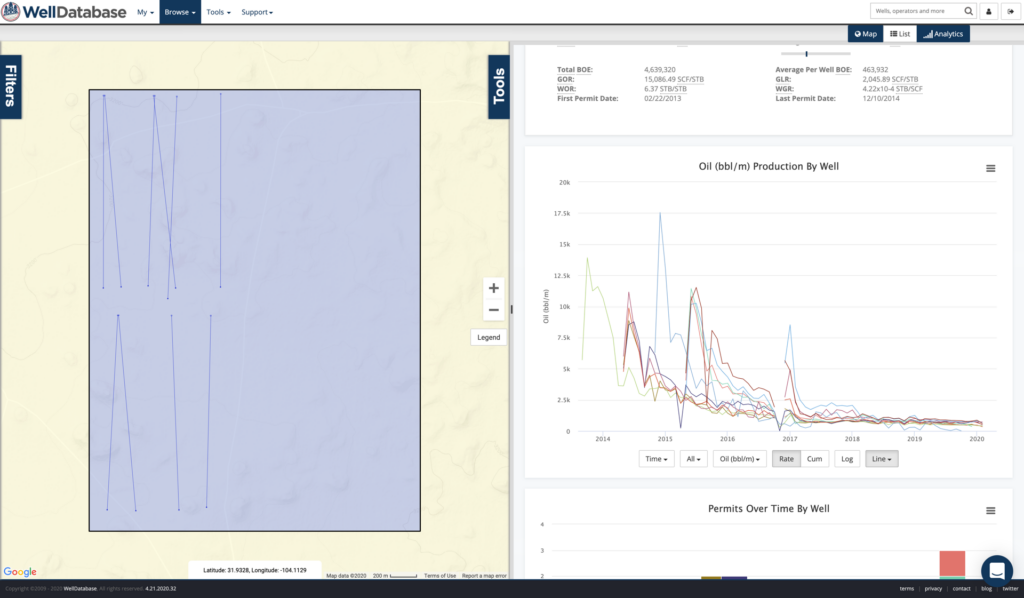
So we’ve just looked at the high level here, declining the full set up producers in one. If you wanted to get more granular, you certainly could forecast each well individually to come up with a more precise answer. As you can see below, these wells in particular have very different declines.
My initial idea was to run through a handful of examples here, but half of you are already nodding off by now. In light of that, we’re going to go ahead and run through a couple examples per day. To make this a little interactive, let us know if there is a particular play/basin you want us to explore. Just leave a comment below, in social media, or shoot us an email.
So far, so good. This example is pretty solid in terms of a temporary (< 1 month) shut in. Since we’re going to do a few of these, we’ll write up a full conclusion at the end. Stay tuned.
1 min read
So laying down rigs is a pretty popular idea. Makes sense. If you stop drilling, you slow your production. It’s also one of the easiest cuts to be...
1 min read
This is the next post in our series on production and the effects we are seeing in the market, completions. If you haven’t caught the other posts,...
1 min read
We rolled out our WellDatabase Lite package a few months ago. The most common question we have gotten is, “What do we get with WellDatabase Lite?”....