 John Ferrell
1 min read
Shutting In Wells
After much fanfare, we are now arriving to the biggest question. What does it look like to shut in wells? How do they come back? What are the pros...


The industry didn't start with unconventionals and neither does our data. We cover the full historical dataset across every producing state and province. Don't settle for inferior data, check out our coverage for any state or province you're interested in.


This is the next post in our series on production and the effects we are seeing in the market, completions. If you haven’t caught the other posts, here are the links:
The Problem…The Whole Problem
The Effect of New Drills
Choking Back Wells
In this post, we’ll explore completion activity and what it means to production. Completions are obviously a hugely significant factor in the effort to reign in production. While there are some concerns about consequences in shutting in existing producers (something we’ll touch on later), leaving a well drilled but not completed is relatively simple.
Estimates on DUCs vary, but most put it in the 7,500-8,000 well range. That’s a pretty big number. We’ve already established what new drills look like back in the effect of new drills post. Completions are where the rubber meets the road.
First lets get a baseline on completions and the reason this variable is so important. Most people know that as soon as you complete a well and start producing, the rate will decline over time. That’s no secret. It’s also not a secret that production * price = revenue. Therefore, if I want to keep generating the same revenue, I have to keep completing new wells.
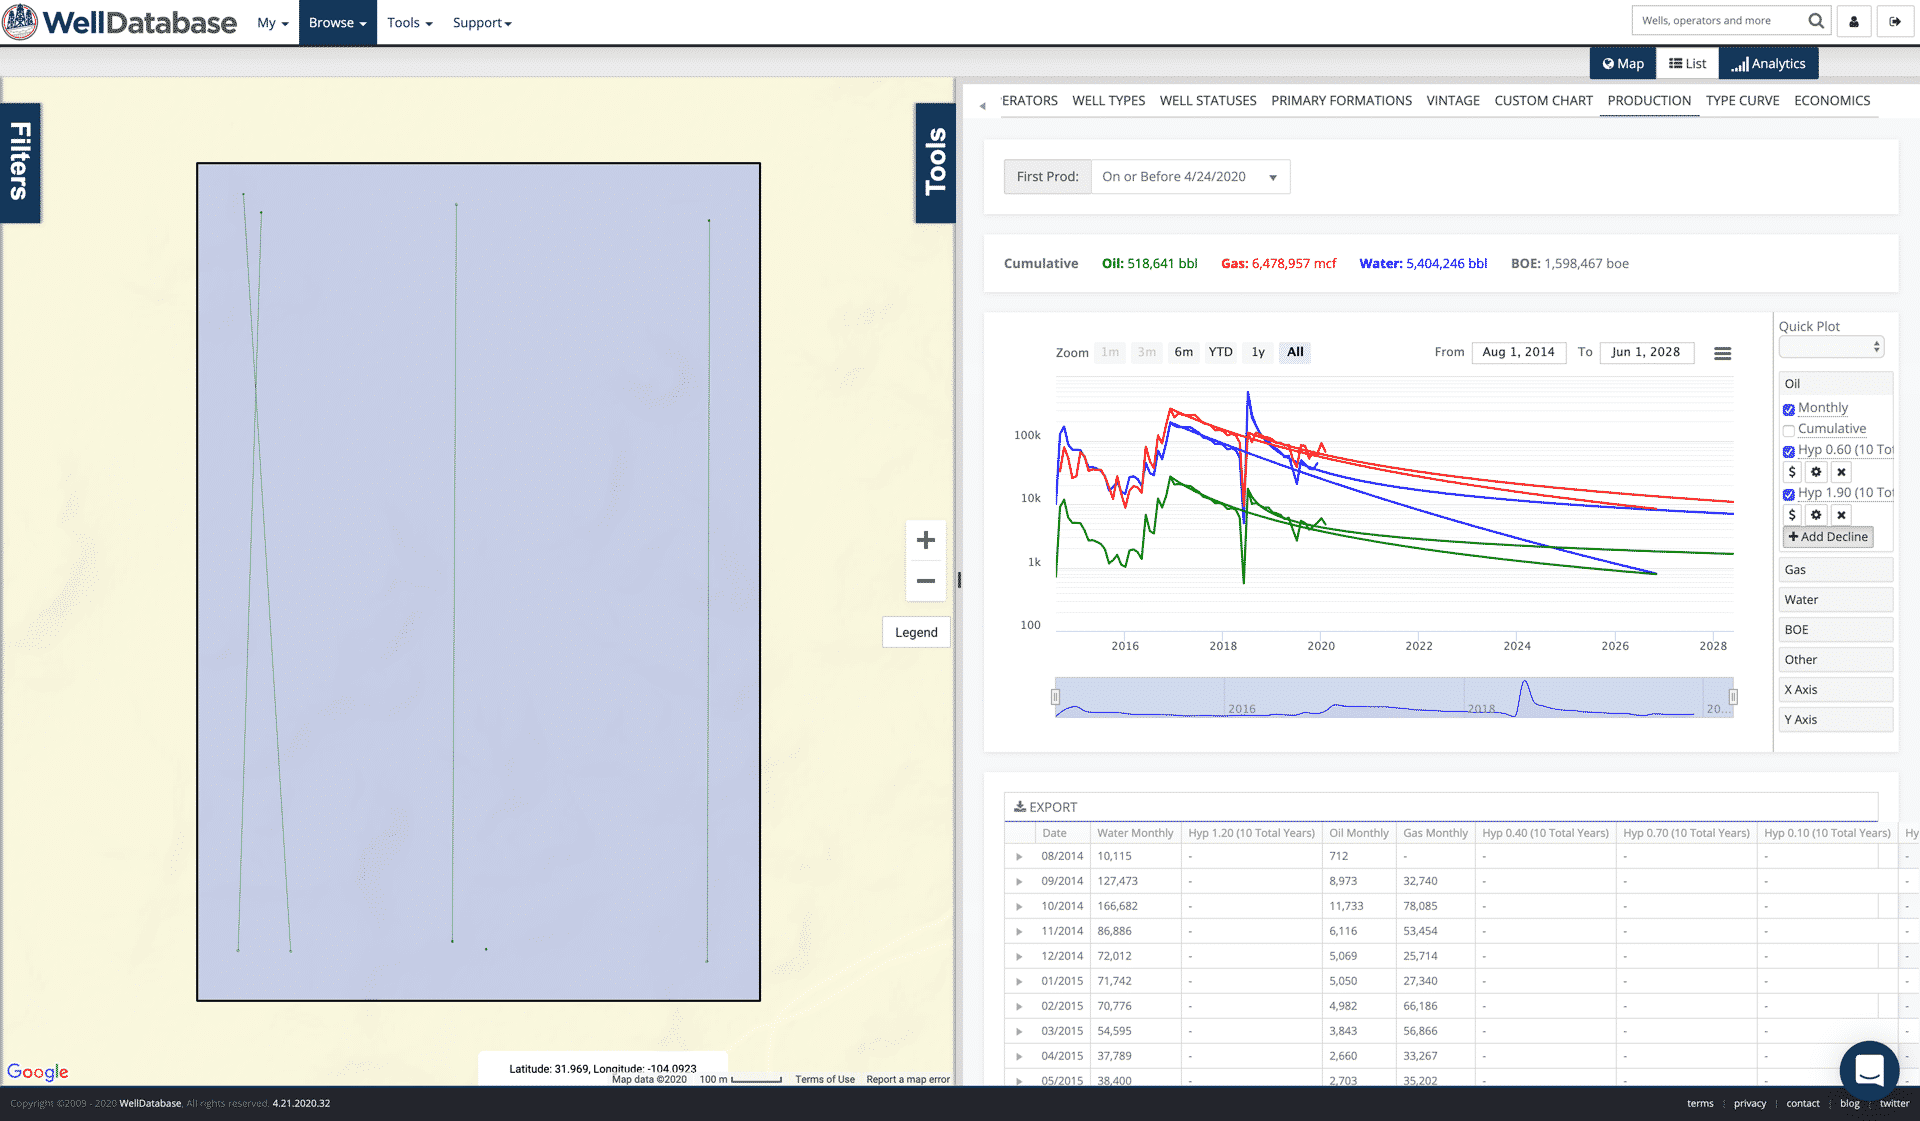
To illustrate this a bit, we’ll pull up the total production for all wells completed in 2018. You can see how the well count and production grows until December and then clearly see the decline from just those wells.
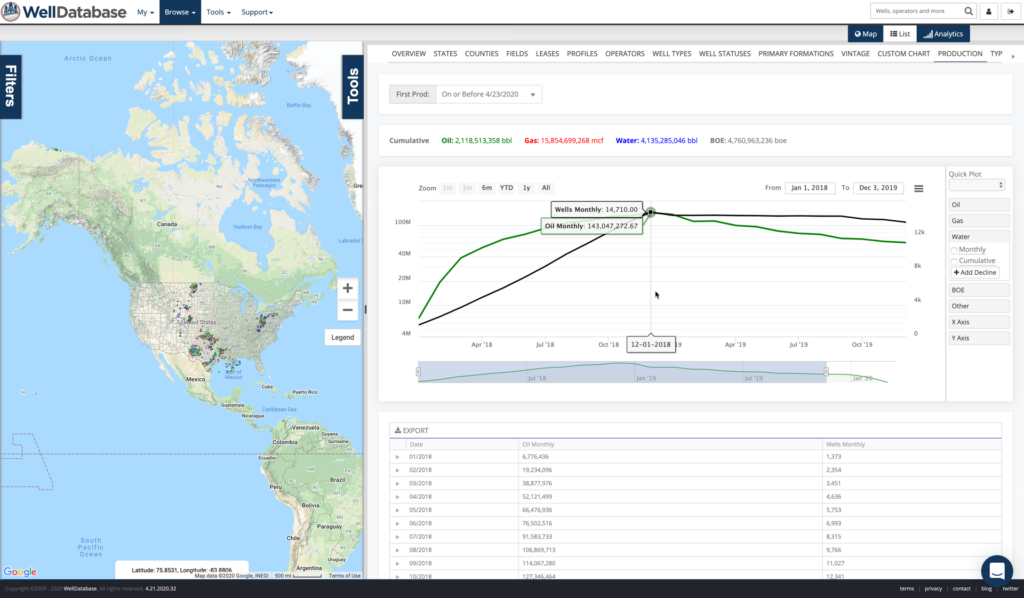
You can see that the production for wells completed in 2018 maxes out at 143 million barrels in December (4.6 million barrels of oil per day).
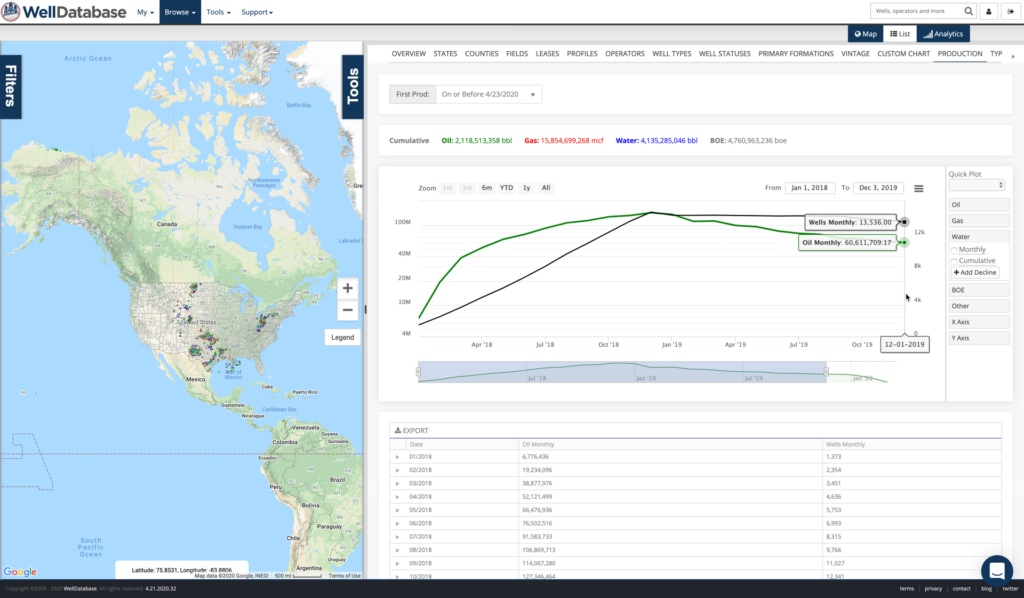
One year later, these same wells are producing 60 million barrels (1.9 million barrels of oil per day)
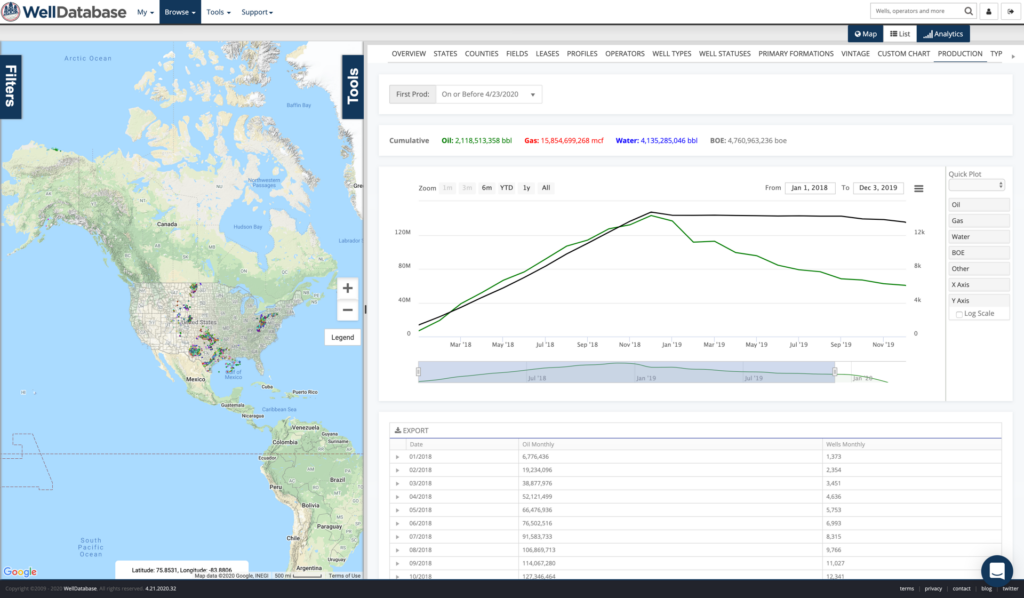
Here’s a look without the log scale to help emphasize the scale of the decline.
Here’s a look at that dynamic over the past five years.
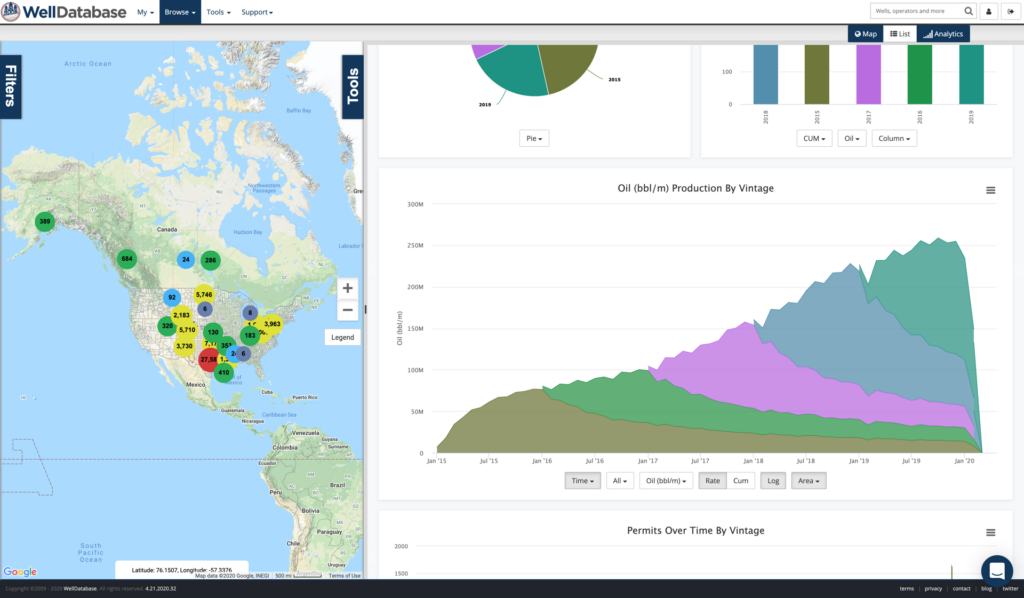
There are a couple interesting points about this. One is that the decline as a function of total production is getting steeper, year over year. Here’s a comparison of the average type curve for wells for the past 5 years.
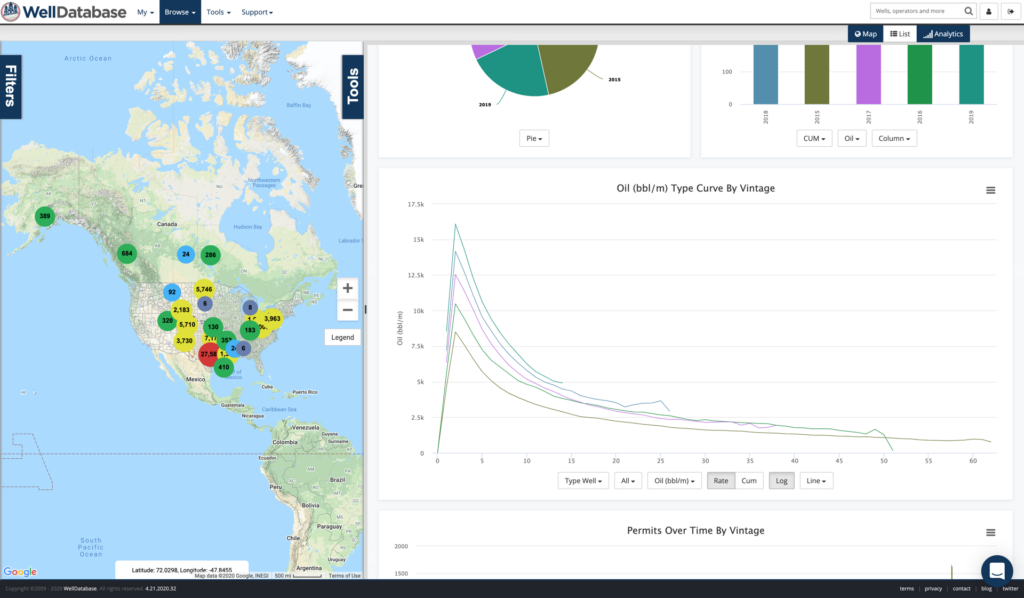
So peaks are getting higher, but interestingly enough, wells are pretty consistent in declining 50% of their production rate over ~7 months. The difference in total production is significant due to the higher peak production volumes.
These charts are averages of 1000s of wells. We are not normalizing for lateral ft, proppant loading, or anything else. We’re looking at total production here, so that wouldn’t make any sense. We can dive in on economics of wells in another post. For the purposes of understanding the effect on US oil production, we only care about the total numbers.
All of this might be ok if operators were simply drilling to maintain production, but that’s not the game we are playing. We have to grow. Why? Don’t ask, please. Just go with it.
Along with the overall growth in initial production, we have also recently seen an uptick in completions.
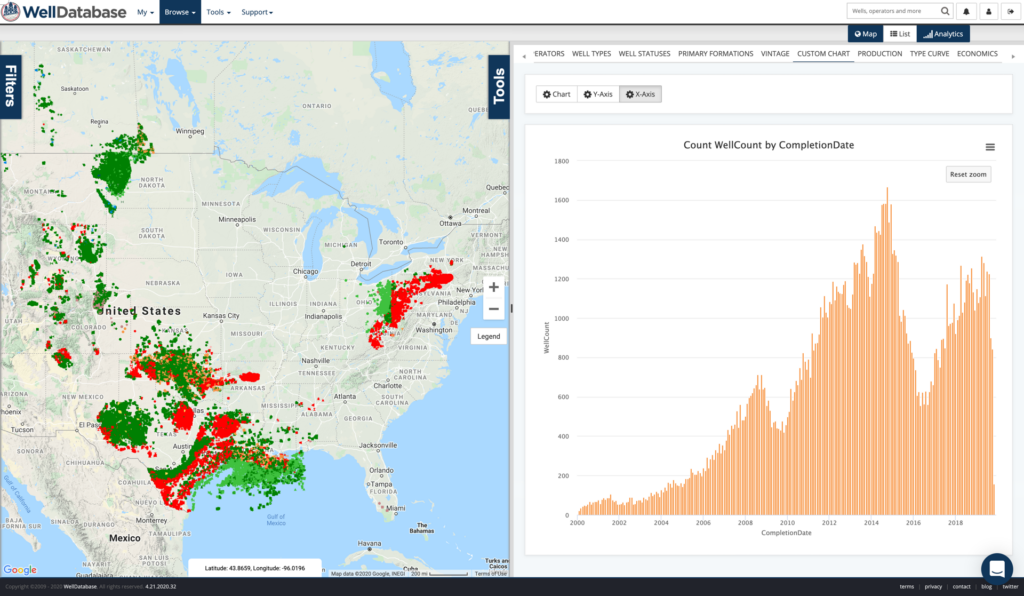
Why not, right? More completions * more production = more revenue. Oh wait, I forgot to add the whole price part in there.
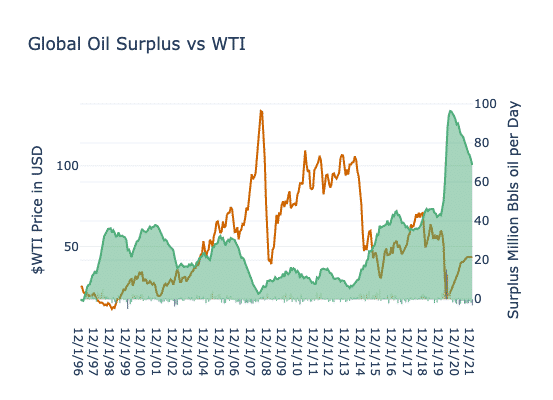
As a refresher, let’s take a look at that surplus vs price chart from the first blog.
That surplus growth (and the tenuous relationship with WTI) can be seen here…and we’re back to the bed we’ve made.
The good news is that with the steep declines, existing production will drop substantially by simply not bring more wells online. The scary part, and reason for this blog, is that we don’t have a real firm idea on plans for reductions in completions. We hear a lot about a general reduction in production plans for 2020, but without specifics, who knows what the immediate term looks like.
As of today, we have 869 completions in January, 683 in February, 363 in March, and 24 in April. Unfortunately, the publicly available data has a decent lag for this. Odds are the numbers in February, March, and April will all rise.
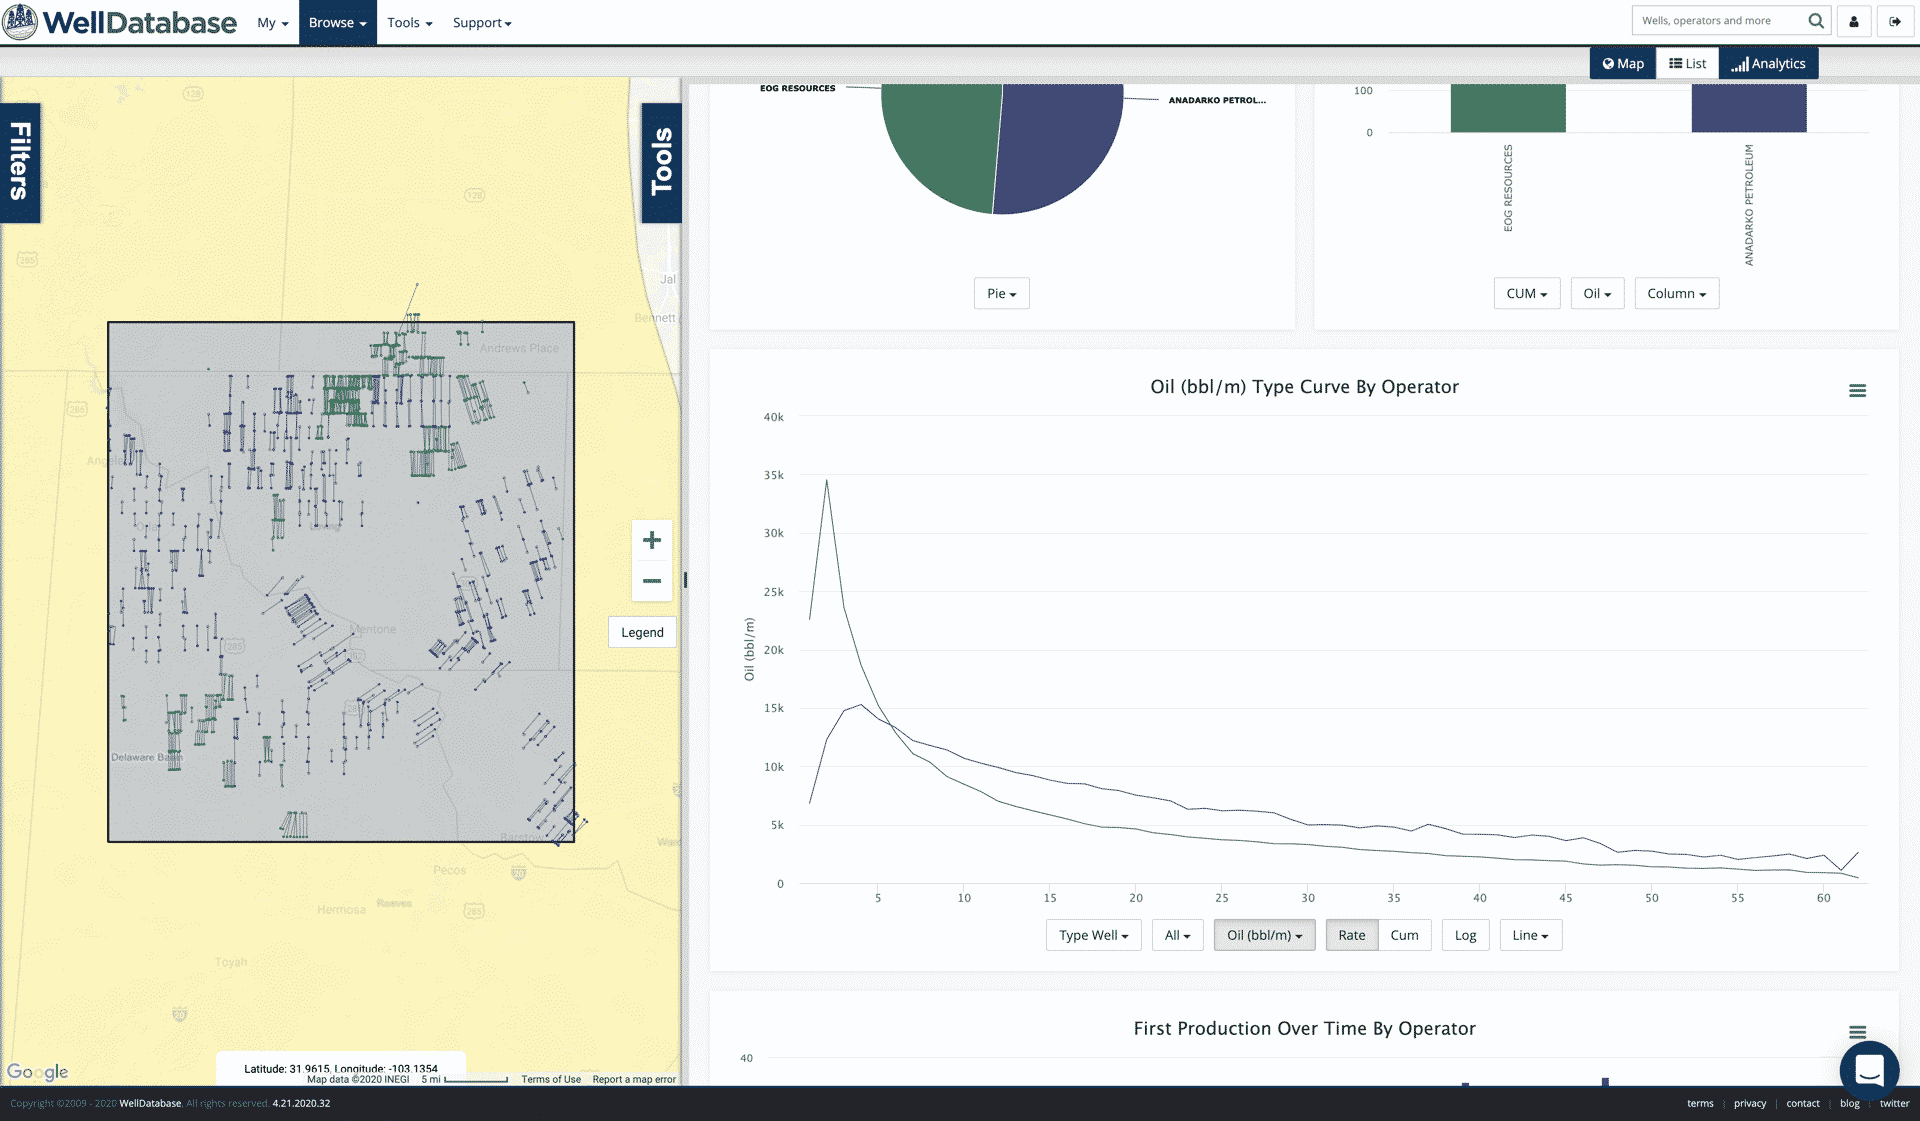
The average oil well completed in 2019 looks like this.
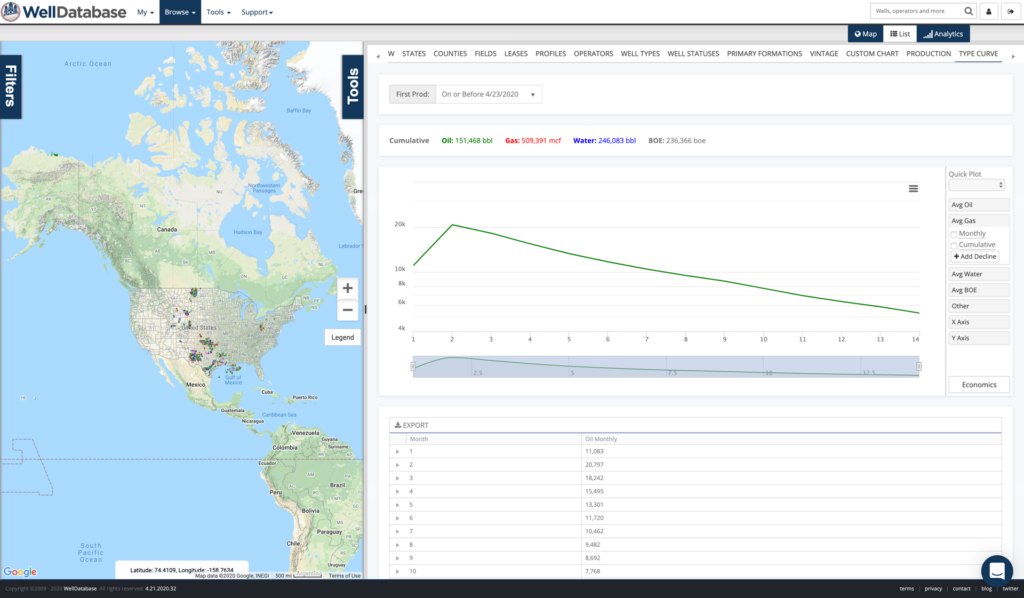
Of course there will be differences based on operators (potentially big differences) and basins. The very average will throw on about 700 barrels of oil per day. As you can see in the charts above, doing nothing will drop production significantly. All of this without worrying about ESPs, formation damage, pressure issues, etc.. Sitting on drilled wells, and bringing them online in a responsible manner, might be the best way to make an impact on our industry.
1 min read
After much fanfare, we are now arriving to the biggest question. What does it look like to shut in wells? How do they come back? What are the pros...
1 min read
While we all like to blame COVID-19 for all of our troubles. The fact is that the industry was already shaky. The coronavirus just gave us the nudge....
1 min read
We’ve been discussing all things production and how they pertain to the current market. If you haven’t read the first parts yet, here are the links