

4 min read
Are four-mile laterals in the Bakken outperforming their shorter neighbors?
I dug into WellDatabase production data, comparing 38 four-mile wells against 61 nearby two- and three-mile offsets, normalized by lateral foot and months since first production.

And even with lower production per foot, the economics could still favor longer laterals through reduced development costs.
What the Production Data Shows
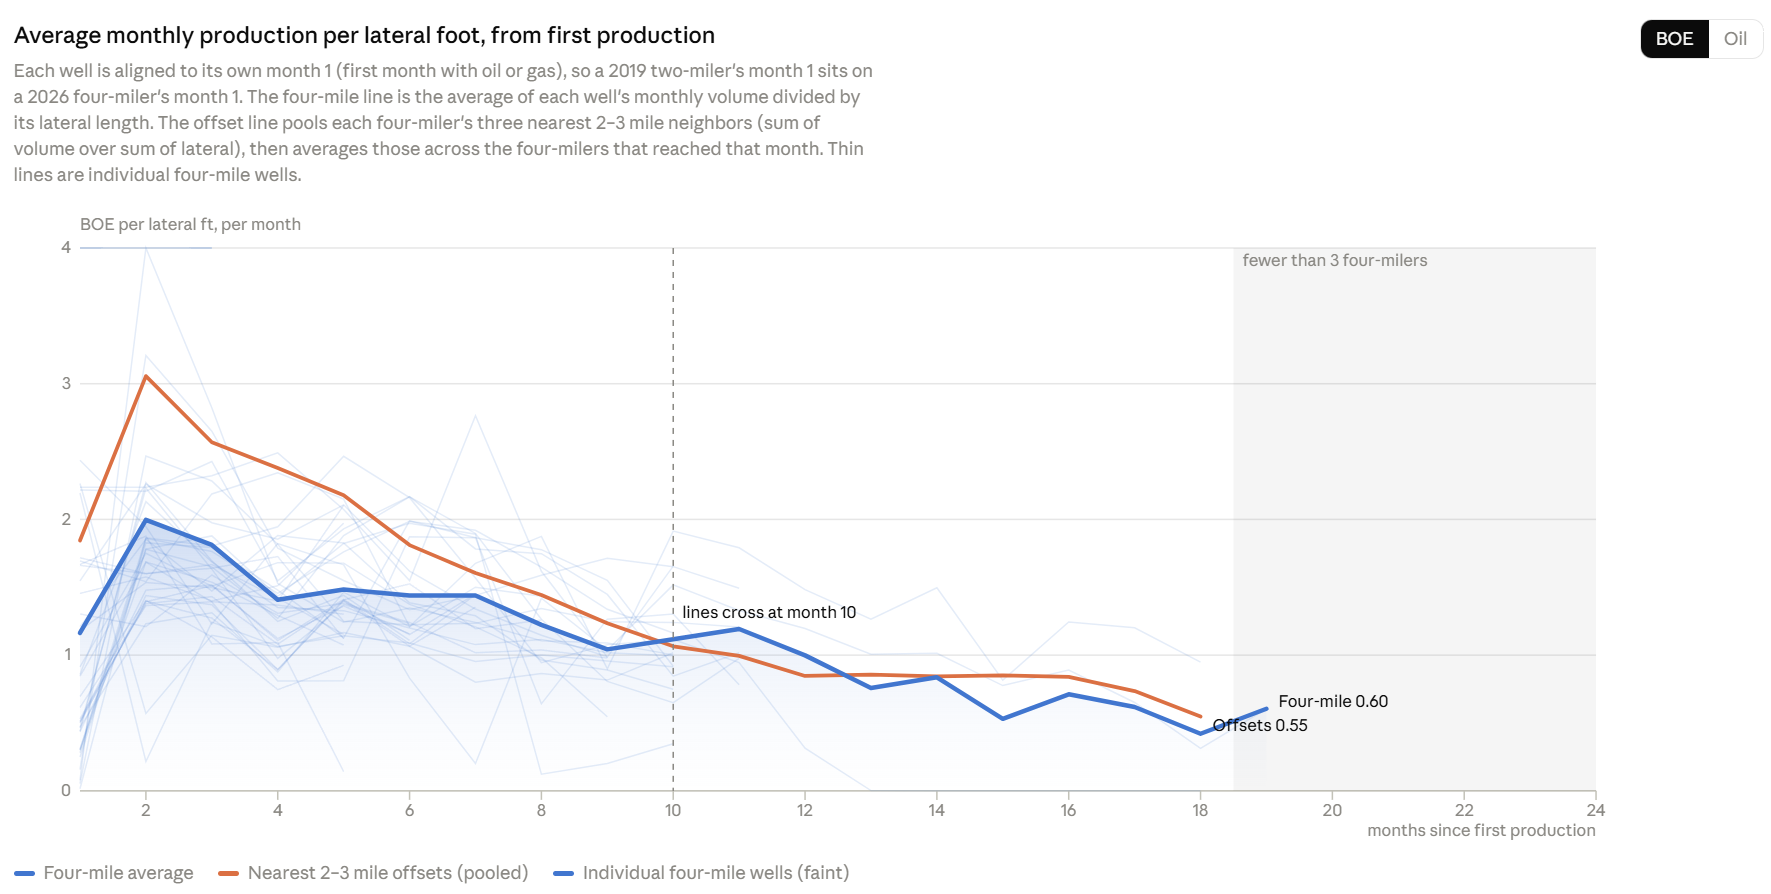
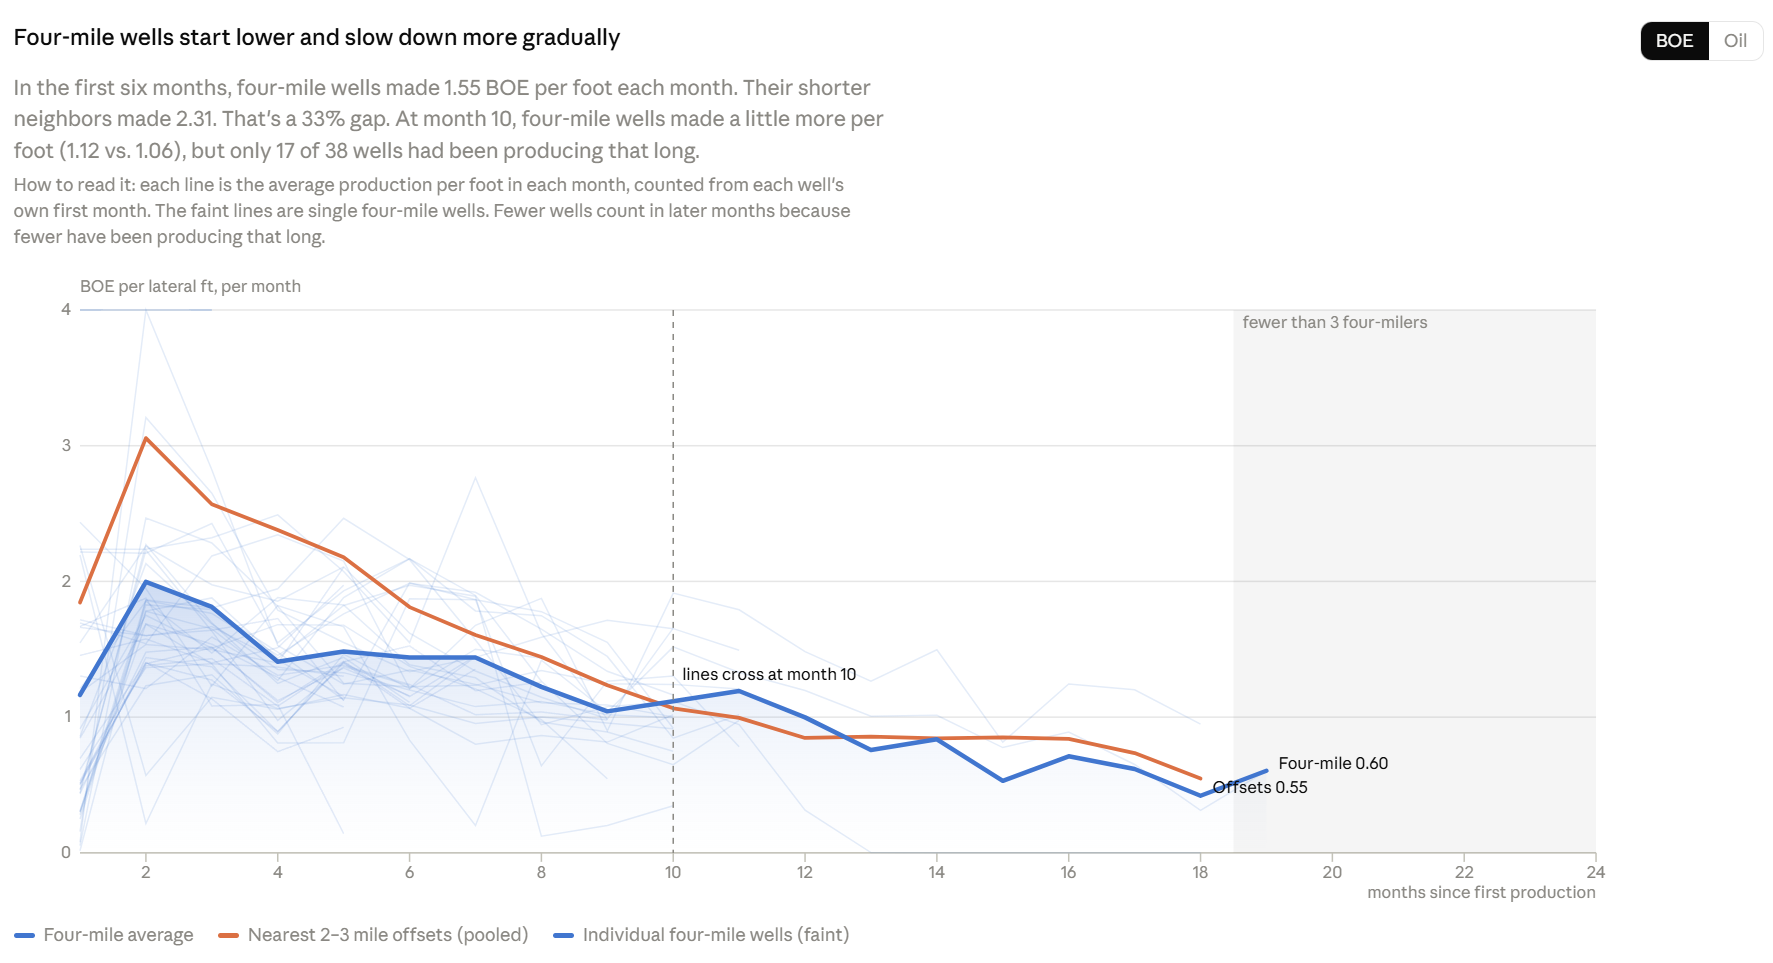
Over the first six months of production, four-mile wells averaged 1.55 BOE per lateral foot per month, compared with 2.31 BOE per foot for their nearest two- and three-mile offsets — a 33% difference.
The four-mile wells also appear to slow down more gradually over the first 10 months. Looking at the same 17 wells that reached month 10, four-mile production dropped approximately 43% from its best month (1.98 to 1.12 BOE/ft), while their shorter neighbors dropped approximately 61% (2.73 to 1.06 BOE/ft). Part of this difference is because the four-mile wells started lower.
At month 10, the four-mile wells averaged 1.12 BOE per foot, compared with 1.06 for their shorter neighbors — a lead of approximately 5%. However, that lead is small and may not last. The three four-mile wells with longer production histories fell back behind their neighbors beginning in month 13.
The number of wells contributing to the monthly comparison also decreases over time: 38 wells at the start, 17 at month 10, eight at month 11, and just three in the later months.
Each well is aligned to its own first month of production, allowing wells with different start dates to be compared at the same stage of their production history.
For this analysis, shorter offsets were selected from wells with lateral lengths between 9,000 and 16,500 feet, first online in 2019 or later, and with at least three months of production history. Each four-mile well was matched with the three qualifying offsets whose lateral midpoints were closest to the four-mile well's heel-to-toe line, within three miles.
A Closer Look at Individual Wells
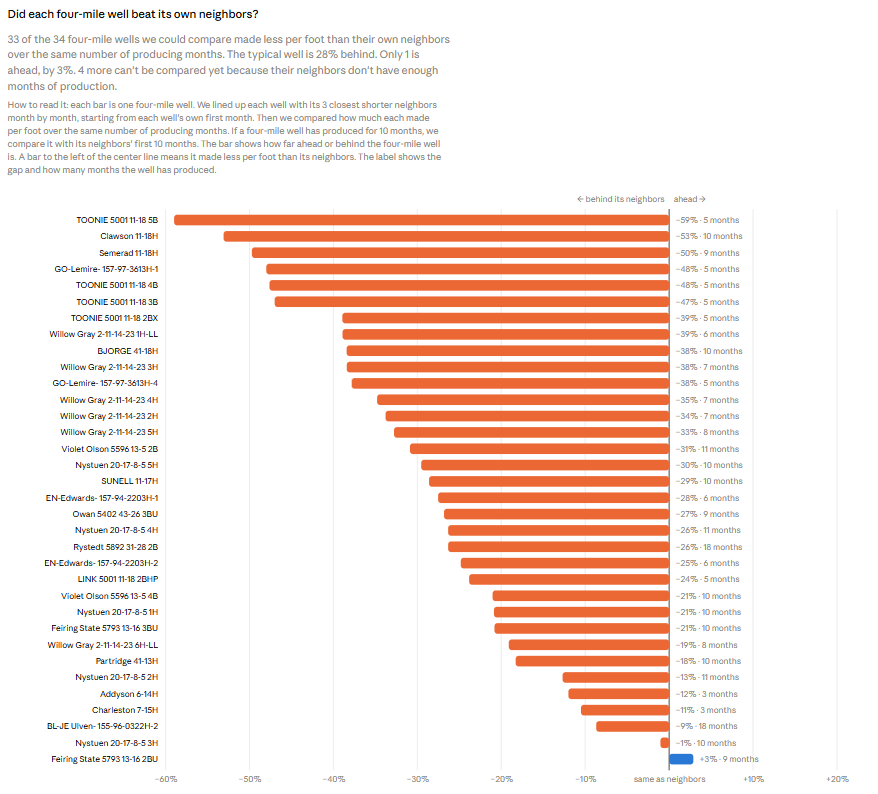
Looking beyond the averages, I compared each four-mile well against its three nearest two- and three-mile neighbors.
Cumulative BOE per lateral foot was measured over the four-mile well's full production history, with offsets compared over the same number of producing months.
Of the 34 four-mile wells with comparable offset data, 33 produced less cumulatively per lateral foot than their shorter neighbors.
- Most were between 10% and 50% behind their offsets.
- The typical four-mile well produced approximately 28% less per foot.
- Only one four-mile well outperformed its offsets, by 3%.
Four additional wells could not be compared because their neighboring offsets did not have sufficient production history.
These results show that while the monthly production curves briefly cross around month 10, nearly all four-mile wells with comparable data still trail their shorter neighbors in cumulative production per foot.
A Closer Look at Two Neighboring Wells
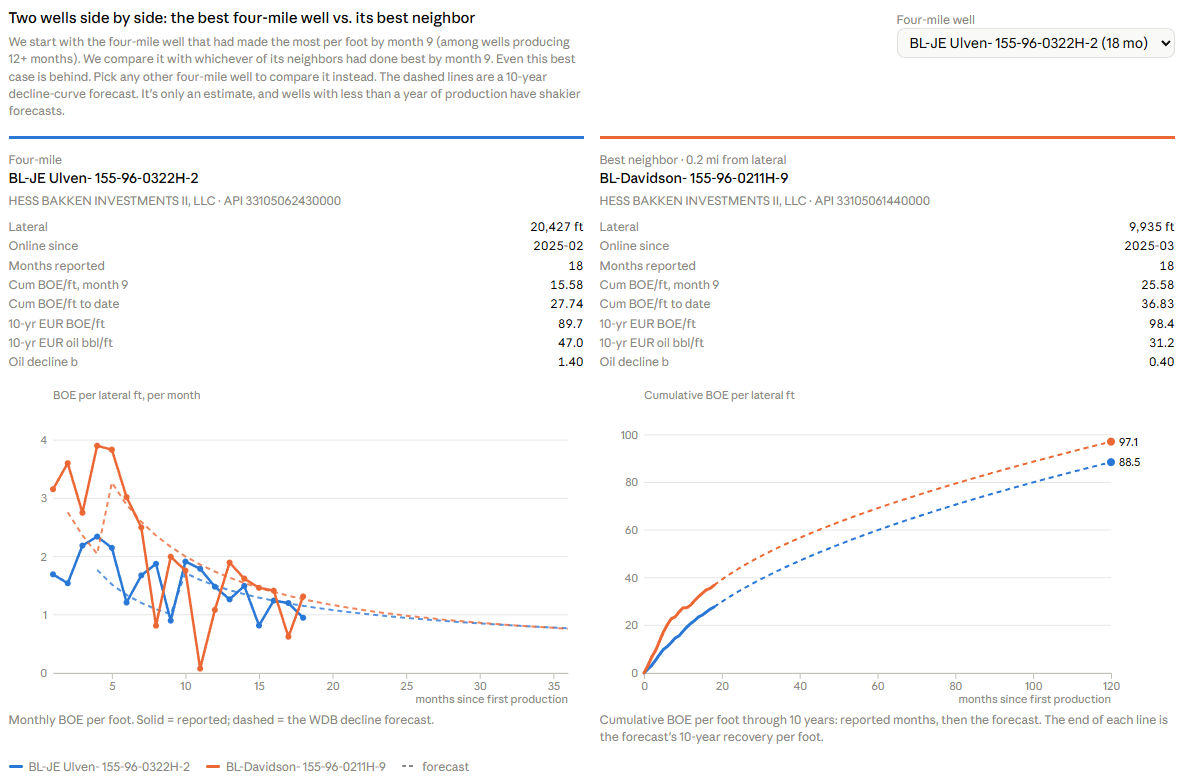
For a closer look, I selected the best-performing four-mile well in the study, based on cumulative BOE per foot at month 9 among wells with at least 12 months of production history, and compared it with its best-performing nearby offset.
Both wells are operated by Hess Bakken Investments II, LLC:
- BL-JE Ulven-155-96-0322H-2: A four-mile well with a 20,427-foot lateral.
- BL-Davidson-155-96-0211H-9: A shorter well with a 9,935-foot lateral, located approximately 0.2 miles from the four-mile lateral.
Both wells have 18 months of reported production history.
At month 9, the four-mile well had produced 15.58 BOE per lateral foot, compared with 25.58 BOE per foot for its shorter neighbor.
Through their latest reported production, the four-mile well reached 27.74 cumulative BOE per foot, compared with 36.83 for the shorter well.
The 10-year production forecasts estimate approximately 89 BOE per foot for the four-mile well and 97 BOE per foot for its shorter neighbor. These are estimates rather than reported production results.
Even in this selected example, the four-mile well trails its shorter neighbor in cumulative production per lateral foot.
What Else Should We Consider?
There's still a lot more to evaluate before drawing conclusions about why four-mile laterals are producing less per foot.
What I can explore further in WellDatabase:
Frac design, including proppant, fluids, and chemical ingredients. These are areas worth investigating to see whether completion differences help explain the production results.
Other factors that could influence production:
- Geology and reservoir quality: Differences in the rock and formation characteristics.
- Parent well depletion: Older nearby wells may have already drained some of the oil and gas.
- Artificial lift: Whether wells are flowing naturally or using gas lift, rod pumps, or electric submersible pumps (ESPs).
- Line pressure: The amount of backpressure from the pipeline.
- Post-frac cleanouts: Whether the entire lateral was effectively cleaned out after completion.
Cleanouts are particularly worth considering with four-mile laterals. Coiled tubing can have difficulty reaching the end of these extended laterals. A Hydraulic Completion Unit (HCU), a heavy-duty type of snubbing unit, can push and rotate jointed pipe farther into the well.
If the far end of a lateral isn't adequately cleaned out, that portion may not contribute to production, potentially making a longer well appear less productive per foot.
Another limitation is formation matching. Most wells in this study are identified simply as "Bakken," so I couldn't match the wells by exact formation.
These are potential influences worth considering, not causes established by this analysis.
What About the Economics?
Even with lower production per lateral foot, longer laterals could still make economic sense through reduced development costs.
According to Chord Energy's reported drilling and completion (D&C) costs:
- Two-mile lateral: $710 per lateral foot
- Three-mile lateral: $568 per lateral foot
- Four-mile lateral: $532 per lateral foot
Source: Chord Energy, August 2026 Investor Presentation.
That puts the four-mile lateral's D&C cost per foot approximately 25% below the two-mile lateral.
Based on these figures, a four-mile well can be drilled and completed for approximately the cost of 1.5 two-mile wells.
Taking the analysis a step further, I compared basic breakeven costs at a 10% rate of return. When accounting for the lower D&C cost per lateral foot, the estimated breakeven costs for the two-mile and four-mile designs were roughly equivalent.
That creates an important distinction: lower production per foot doesn't necessarily translate to worse economics.
The production comparisons and economic estimates raise different questions, and both matter when evaluating the potential benefits of longer laterals.
The Bigger Question
Are these longer laterals less productive per foot, or are we seeing the effects of infill development in depleted reservoirs?
And even with lower production per foot, the economics could still favor longer laterals through reduced development costs.
Plenty more to unpack here, and the data is starting to tell an interesting story.
Want to explore the data further? Dive into WellDatabase and see what you uncover.